Bermudan vs Immigrants from Cabo Verde Associate's Degree
COMPARE
Bermudan
Immigrants from Cabo Verde
Associate's Degree
Associate's Degree Comparison
Bermudans
Immigrants from Cabo Verde
46.2%
ASSOCIATE'S DEGREE
46.4/ 100
METRIC RATING
180th/ 347
METRIC RANK
36.8%
ASSOCIATE'S DEGREE
0.0/ 100
METRIC RATING
323rd/ 347
METRIC RANK
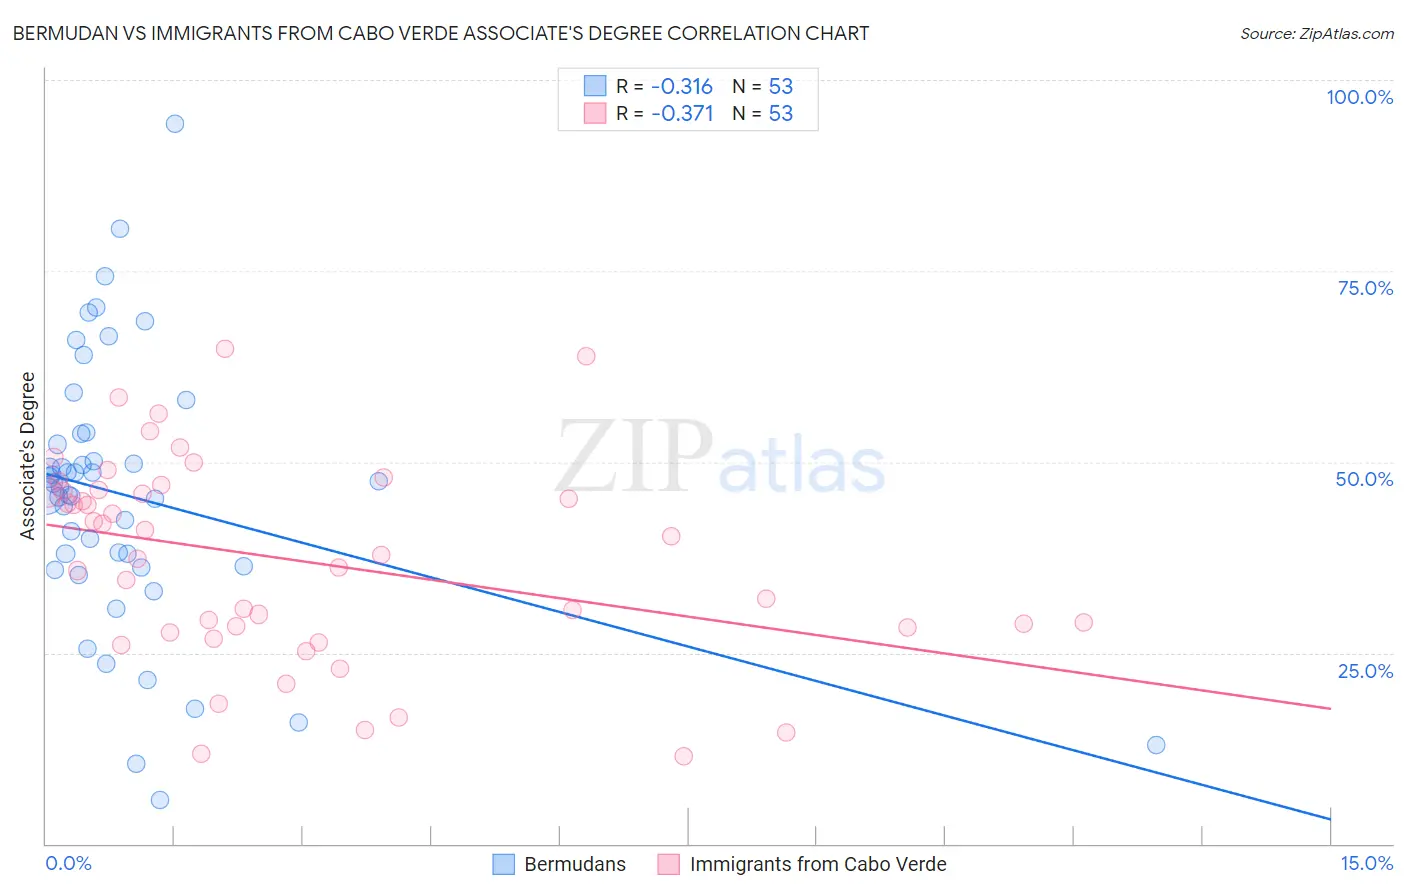
Bermudan vs Immigrants from Cabo Verde Associate's Degree Correlation Chart
The statistical analysis conducted on geographies consisting of 55,732,793 people shows a mild negative correlation between the proportion of Bermudans and percentage of population with at least associate's degree education in the United States with a correlation coefficient (R) of -0.316 and weighted average of 46.2%. Similarly, the statistical analysis conducted on geographies consisting of 38,158,666 people shows a mild negative correlation between the proportion of Immigrants from Cabo Verde and percentage of population with at least associate's degree education in the United States with a correlation coefficient (R) of -0.371 and weighted average of 36.8%, a difference of 25.7%.
Associate's Degree Correlation Summary
| Measurement | Bermudan | Immigrants from Cabo Verde |
| Minimum | 5.7% | 11.5% |
| Maximum | 94.2% | 64.7% |
| Range | 88.5% | 53.3% |
| Mean | 45.5% | 37.2% |
| Median | 46.6% | 37.7% |
| Interquartile 25% (IQ1) | 36.2% | 28.0% |
| Interquartile 75% (IQ3) | 53.0% | 46.2% |
| Interquartile Range (IQR) | 16.8% | 18.3% |
| Standard Deviation (Sample) | 17.5% | 13.1% |
| Standard Deviation (Population) | 17.4% | 13.0% |
Similar Demographics by Associate's Degree
Demographics Similar to Bermudans by Associate's Degree
In terms of associate's degree, the demographic groups most similar to Bermudans are Sri Lankan (46.3%, a difference of 0.090%), Immigrants from Bosnia and Herzegovina (46.3%, a difference of 0.14%), Slovak (46.3%, a difference of 0.15%), Finnish (46.3%, a difference of 0.16%), and Belgian (46.3%, a difference of 0.19%).
| Demographics | Rating | Rank | Associate's Degree |
| Immigrants | Iraq | 50.3 /100 | #173 | Average 46.4% |
| English | 50.0 /100 | #174 | Average 46.4% |
| Belgians | 48.9 /100 | #175 | Average 46.3% |
| Finns | 48.5 /100 | #176 | Average 46.3% |
| Slovaks | 48.4 /100 | #177 | Average 46.3% |
| Immigrants | Bosnia and Herzegovina | 48.3 /100 | #178 | Average 46.3% |
| Sri Lankans | 47.6 /100 | #179 | Average 46.3% |
| Bermudans | 46.4 /100 | #180 | Average 46.2% |
| Immigrants | Colombia | 41.3 /100 | #181 | Average 46.0% |
| Swiss | 40.4 /100 | #182 | Average 46.0% |
| Yugoslavians | 40.2 /100 | #183 | Average 46.0% |
| Czechoslovakians | 40.0 /100 | #184 | Average 46.0% |
| Costa Ricans | 38.6 /100 | #185 | Fair 46.0% |
| Welsh | 37.9 /100 | #186 | Fair 45.9% |
| Immigrants | Uruguay | 35.5 /100 | #187 | Fair 45.8% |
Demographics Similar to Immigrants from Cabo Verde by Associate's Degree
In terms of associate's degree, the demographic groups most similar to Immigrants from Cabo Verde are Arapaho (36.7%, a difference of 0.16%), Menominee (36.7%, a difference of 0.27%), Kiowa (36.5%, a difference of 0.83%), Dutch West Indian (36.5%, a difference of 0.85%), and Alaskan Athabascan (36.5%, a difference of 0.86%).
| Demographics | Rating | Rank | Associate's Degree |
| Crow | 0.0 /100 | #316 | Tragic 37.6% |
| Yaqui | 0.0 /100 | #317 | Tragic 37.6% |
| Alaska Natives | 0.0 /100 | #318 | Tragic 37.5% |
| Fijians | 0.0 /100 | #319 | Tragic 37.4% |
| Cajuns | 0.0 /100 | #320 | Tragic 37.4% |
| Immigrants | Yemen | 0.0 /100 | #321 | Tragic 37.3% |
| Pennsylvania Germans | 0.0 /100 | #322 | Tragic 37.2% |
| Immigrants | Cabo Verde | 0.0 /100 | #323 | Tragic 36.8% |
| Arapaho | 0.0 /100 | #324 | Tragic 36.7% |
| Menominee | 0.0 /100 | #325 | Tragic 36.7% |
| Kiowa | 0.0 /100 | #326 | Tragic 36.5% |
| Dutch West Indians | 0.0 /100 | #327 | Tragic 36.5% |
| Alaskan Athabascans | 0.0 /100 | #328 | Tragic 36.5% |
| Paiute | 0.0 /100 | #329 | Tragic 36.4% |
| Apache | 0.0 /100 | #330 | Tragic 36.2% |