Nigerian vs Immigrants from Egypt Associate's Degree

COMPARE

Nigerian
Race
Ancestry
AfghanAfricanAlaska NativeAlaskan AthabascanAlbanianAleutAlsatianAmericanApacheArabArapahoArgentineanArmenianAssyrian/Chaldean/SyriacAustralianAustrianBahamianBangladeshiBarbadianBasqueBelgianBelizeanBermudanBhutaneseBlackfeetBolivianBrazilianBritishBritish West IndianBulgarianBurmeseCajunCambodianCanadianCape VerdeanCarpatho RusynCelticCentral AmericanCentral American IndianCherokeeCheyenneChickasawChileanChineseChippewaChoctawColombianColvilleComancheCosta RicanCreeCreekCroatianCrowCubanCypriotCzechCzechoslovakianDanishDelawareDominicanDutchDutch West IndianEastern EuropeanEcuadorianEgyptianEnglishEstonianEthiopianEuropeanFijianFilipinoFinnishFrenchFrench American IndianFrench CanadianGermanGerman RussianGhanaianGreekGuamanian/ChamorroGuatemalanGuyaneseHaitianHmongHonduranHopiHoumaHungarianIcelanderIndian (Asian)IndonesianInupiatIranianIraqiIrishIroquoisIsraeliItalianJamaicanJapaneseJordanianKenyanKiowaKoreanLaotianLatvianLebaneseLiberianLithuanianLumbeeLuxembourgerMacedonianMalaysianMalteseMarshalleseMenomineeMexicanMexican American IndianMongolianMoroccanNative HawaiianNavajoNepaleseNew ZealanderNicaraguanNigerianNorthern EuropeanNorwegianOkinawanOsageOttawaPaiutePakistaniPalestinianPanamanianParaguayanPennsylvania GermanPeruvianPimaPolishPortuguesePotawatomiPuebloPuerto RicanPuget Sound SalishRomanianRussianSalvadoranSamoanScandinavianScotch-IrishScottishSeminoleSenegaleseSerbianShoshoneSierra LeoneanSiouxSlavicSlovakSloveneSomaliSouth AfricanSouth AmericanSouth American IndianSoviet UnionSpaniardSpanishSpanish AmericanSpanish American IndianSri LankanSubsaharan AfricanSudaneseSwedishSwissSyrianTaiwaneseThaiTlingit-HaidaTohono O'OdhamTonganTrinidadian and TobagonianTsimshianTurkishU.S. Virgin IslanderUgandanUkrainianUruguayanUteVenezuelanVietnameseWelshWest IndianYakamaYaquiYugoslavianYumanYup'ikZimbabwean
Immigration
NonimmigrantsImmigrantsAfghanistanAfricaAlbaniaArgentinaArmeniaAsiaAustraliaAustriaBahamasBangladeshBarbadosBelarusBelgiumBelizeBoliviaBosnia and HerzegovinaBrazilBulgariaBurma/MyanmarCabo VerdeCambodiaCameroonCanadaCaribbeanCentral AmericaChileChinaColombiaCongoCosta RicaCroatiaCubaCzechoslovakiaDenmarkDominicaDominican RepublicEastern AfricaEastern AsiaEastern EuropeEcuadorEl SalvadorEnglandEritreaEthiopiaEuropeFijiFranceGermanyGhanaGreeceGrenadaGuatemalaGuyanaHaitiHondurasHong KongHungaryIndiaIndonesiaIranIraqIrelandIsraelItalyJamaicaJapanJordanKazakhstanKenyaKoreaKuwaitLaosLatin AmericaLatviaLebanonLiberiaLithuaniaMalaysiaMexicoMicronesiaMiddle AfricaMoldovaMoroccoNepalNetherlandsNicaraguaNigeriaNorth AmericaNorth MacedoniaNorthern AfricaNorthern EuropeNorwayOceaniaPakistanPanamaPeruPhilippinesPolandPortugalRomaniaRussiaSaudi ArabiaScotlandSenegalSerbiaSierra LeoneSingaporeSomaliaSouth AfricaSouth AmericaSouth Central AsiaSouth Eastern AsiaSouthern EuropeSpainSri LankaSt. Vincent and the GrenadinesSudanSwedenSwitzerlandSyriaTaiwanThailandTrinidad and TobagoTurkeyUgandaUkraineUruguayUzbekistanVenezuelaVietnamWest IndiesWestern AfricaWestern AsiaWestern EuropeYemenZaireZimbabweAzores
Immigrants from Egypt
Race
Ancestry
AfghanAfricanAlaska NativeAlaskan AthabascanAlbanianAleutAlsatianAmericanApacheArabArapahoArgentineanArmenianAssyrian/Chaldean/SyriacAustralianAustrianBahamianBangladeshiBarbadianBasqueBelgianBelizeanBermudanBhutaneseBlackfeetBolivianBrazilianBritishBritish West IndianBulgarianBurmeseCajunCambodianCanadianCape VerdeanCarpatho RusynCelticCentral AmericanCentral American IndianCherokeeCheyenneChickasawChileanChineseChippewaChoctawColombianColvilleComancheCosta RicanCreeCreekCroatianCrowCubanCypriotCzechCzechoslovakianDanishDelawareDominicanDutchDutch West IndianEastern EuropeanEcuadorianEgyptianEnglishEstonianEthiopianEuropeanFijianFilipinoFinnishFrenchFrench American IndianFrench CanadianGermanGerman RussianGhanaianGreekGuamanian/ChamorroGuatemalanGuyaneseHaitianHmongHonduranHopiHoumaHungarianIcelanderIndian (Asian)IndonesianInupiatIranianIraqiIrishIroquoisIsraeliItalianJamaicanJapaneseJordanianKenyanKiowaKoreanLaotianLatvianLebaneseLiberianLithuanianLumbeeLuxembourgerMacedonianMalaysianMalteseMarshalleseMenomineeMexicanMexican American IndianMongolianMoroccanNative HawaiianNavajoNepaleseNew ZealanderNicaraguanNorthern EuropeanNorwegianOkinawanOsageOttawaPaiutePakistaniPalestinianPanamanianParaguayanPennsylvania GermanPeruvianPimaPolishPortuguesePotawatomiPuebloPuerto RicanPuget Sound SalishRomanianRussianSalvadoranSamoanScandinavianScotch-IrishScottishSeminoleSenegaleseSerbianShoshoneSierra LeoneanSiouxSlavicSlovakSloveneSomaliSouth AfricanSouth AmericanSouth American IndianSoviet UnionSpaniardSpanishSpanish AmericanSpanish American IndianSri LankanSubsaharan AfricanSudaneseSwedishSwissSyrianTaiwaneseThaiTlingit-HaidaTohono O'OdhamTonganTrinidadian and TobagonianTsimshianTurkishU.S. Virgin IslanderUgandanUkrainianUruguayanUteVenezuelanVietnameseWelshWest IndianYakamaYaquiYugoslavianYumanYup'ikZimbabwean
Immigration
NonimmigrantsImmigrantsAfghanistanAfricaAlbaniaArgentinaArmeniaAsiaAustraliaAustriaBahamasBangladeshBarbadosBelarusBelgiumBelizeBoliviaBosnia and HerzegovinaBrazilBulgariaBurma/MyanmarCabo VerdeCambodiaCameroonCanadaCaribbeanCentral AmericaChileChinaColombiaCongoCosta RicaCroatiaCubaCzechoslovakiaDenmarkDominicaDominican RepublicEastern AfricaEastern AsiaEastern EuropeEcuadorEgyptEl SalvadorEnglandEritreaEthiopiaEuropeFijiFranceGermanyGhanaGreeceGrenadaGuatemalaGuyanaHaitiHondurasHong KongHungaryIndiaIndonesiaIranIraqIrelandIsraelItalyJamaicaJapanJordanKazakhstanKenyaKoreaKuwaitLaosLatin AmericaLatviaLebanonLiberiaLithuaniaMalaysiaMexicoMicronesiaMiddle AfricaMoldovaMoroccoNepalNetherlandsNicaraguaNigeriaNorth AmericaNorth MacedoniaNorthern AfricaNorthern EuropeNorwayOceaniaPakistanPanamaPeruPhilippinesPolandPortugalRomaniaRussiaSaudi ArabiaScotlandSenegalSerbiaSierra LeoneSingaporeSomaliaSouth AfricaSouth AmericaSouth Central AsiaSouth Eastern AsiaSouthern EuropeSpainSri LankaSt. Vincent and the GrenadinesSudanSwedenSwitzerlandSyriaTaiwanThailandTrinidad and TobagoTurkeyUgandaUkraineUruguayUzbekistanVenezuelaVietnamWest IndiesWestern AfricaWestern AsiaWestern EuropeYemenZaireZimbabweAzores
Associate's Degree
Income
Poverty
Unemployment
Labor Participation
Family Structure
Vehicle Availability
Education Level
Disability

Associate's Degree Comparison

Nigerians

Immigrants from Egypt

Poor
Exceptional
45.1%
ASSOCIATE'S DEGREE
19.1/ 100
METRIC RATING
204th/ 347
METRIC RANK
50.2%
ASSOCIATE'S DEGREE
98.9/ 100
METRIC RATING
85th/ 347
METRIC RANK

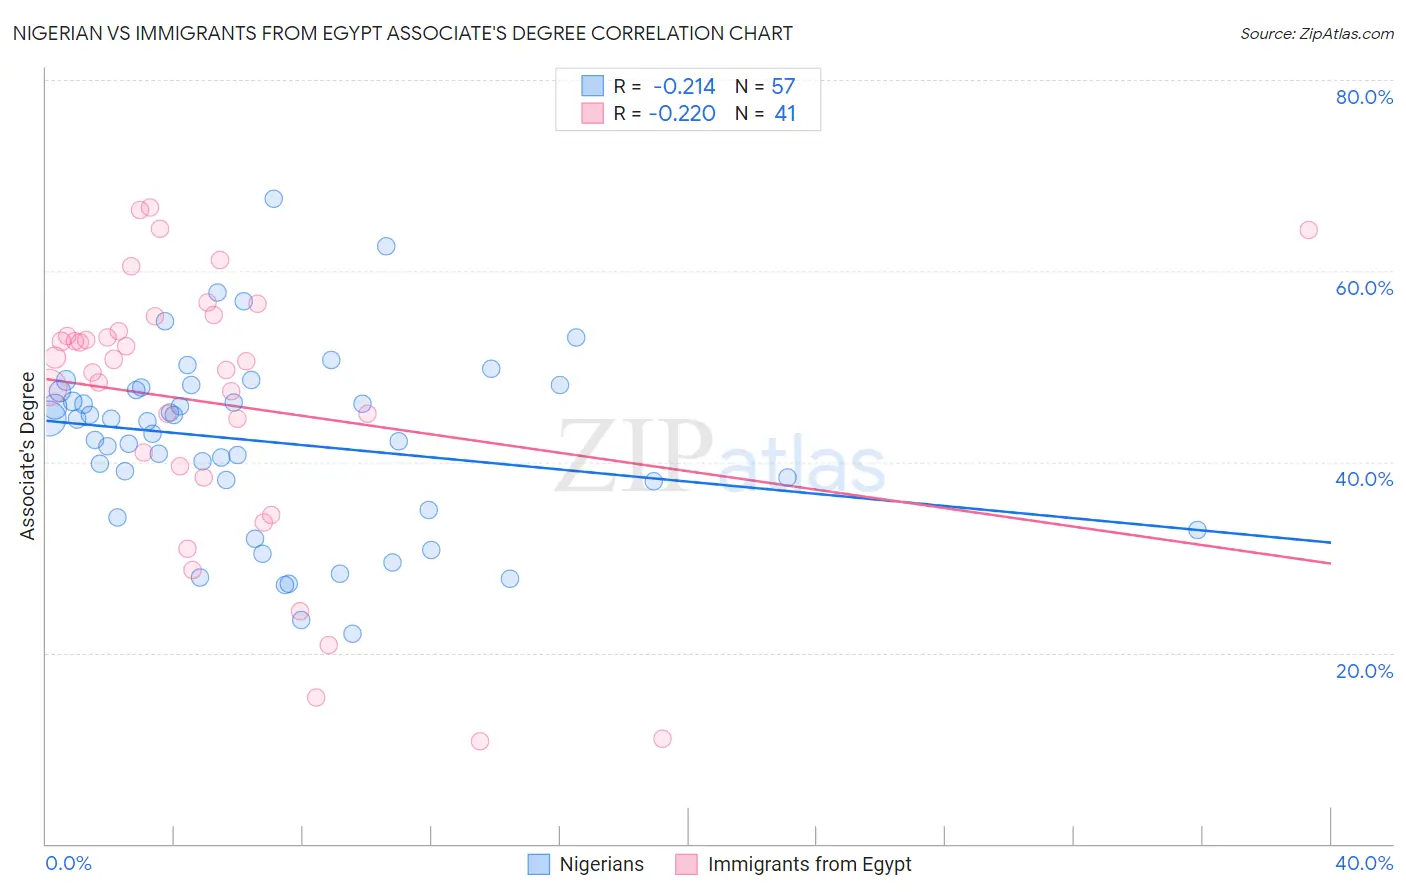
Nigerian vs Immigrants from Egypt Associate's Degree Correlation Chart

The statistical analysis conducted on geographies consisting of 332,751,702 people shows a weak negative correlation between the proportion of Nigerians and percentage of population with at least associate's degree education in the United States with a correlation coefficient (R) of -0.214 and weighted average of 45.1%. Similarly, the statistical analysis conducted on geographies consisting of 245,484,715 people shows a weak negative correlation between the proportion of Immigrants from Egypt and percentage of population with at least associate's degree education in the United States with a correlation coefficient (R) of -0.220 and weighted average of 50.2%, a difference of 11.4%.
Nigerian vs Immigrants from Egypt Associate's Degree

Associate's Degree Correlation Summary

MeasurementNigerianImmigrants from Egypt
Minimum22.0%10.8%
Maximum67.5%66.7%
Range45.6%55.9%
Mean42.1%46.0%
Median44.3%50.5%
Interquartile 25% (IQ1)36.5%38.9%
Interquartile 75% (IQ3)47.7%54.4%
Interquartile Range (IQR)11.2%15.5%
Standard Deviation (Sample)9.4%14.4%
Standard Deviation (Population)9.4%14.2%

Similar Demographics by Associate's Degree

Demographics Similar to Nigerians by Associate's Degree

In terms of associate's degree, the demographic groups most similar to Nigerians are Immigrants from Thailand (45.1%, a difference of 0.020%), German Russian (45.1%, a difference of 0.030%), Panamanian (45.1%, a difference of 0.090%), Immigrants from South Eastern Asia (45.2%, a difference of 0.14%), and Spaniard (45.2%, a difference of 0.16%).
DemographicsRating | RankAssociate's Degree
Scotch-Irish
22.3
/100
|
#197
Fair
45.3%
Immigrants | Bangladesh
21.3
/100
|
#198
Fair
45.2%
Immigrants | Senegal
21.2
/100
|
#199
Fair
45.2%
Senegalese
21.1
/100
|
#200
Fair
45.2%
Immigrants | Vietnam
20.8
/100
|
#201
Fair
45.2%
Spaniards
20.4
/100
|
#202
Fair
45.2%
Immigrants | South Eastern Asia
20.2
/100
|
#203
Fair
45.2%
Nigerians
19.1
/100
|
#204
Poor
45.1%
Immigrants | Thailand
18.9
/100
|
#205
Poor
45.1%
German Russians
18.9
/100
|
#206
Poor
45.1%
Panamanians
18.4
/100
|
#207
Poor
45.1%
Dutch
17.6
/100
|
#208
Poor
45.0%
Immigrants | Costa Rica
16.7
/100
|
#209
Poor
45.0%
Immigrants | Philippines
16.7
/100
|
#210
Poor
45.0%
Immigrants | Zaire
16.6
/100
|
#211
Poor
45.0%

Demographics Similar to Immigrants from Egypt by Associate's Degree

In terms of associate's degree, the demographic groups most similar to Immigrants from Egypt are Immigrants from Croatia (50.2%, a difference of 0.010%), Immigrants from Hungary (50.2%, a difference of 0.050%), Immigrants from Uzbekistan (50.3%, a difference of 0.070%), Greek (50.3%, a difference of 0.11%), and Immigrants from Moldova (50.2%, a difference of 0.13%).
DemographicsRating | RankAssociate's Degree
Immigrants | Eastern Europe
99.1
/100
|
#78
Exceptional
50.5%
Ethiopians
99.1
/100
|
#79
Exceptional
50.4%
Armenians
99.1
/100
|
#80
Exceptional
50.4%
Maltese
99.1
/100
|
#81
Exceptional
50.4%
Greeks
98.9
/100
|
#82
Exceptional
50.3%
Immigrants | Uzbekistan
98.9
/100
|
#83
Exceptional
50.3%
Immigrants | Hungary
98.9
/100
|
#84
Exceptional
50.2%
Immigrants | Egypt
98.9
/100
|
#85
Exceptional
50.2%
Immigrants | Croatia
98.9
/100
|
#86
Exceptional
50.2%
Immigrants | Moldova
98.8
/100
|
#87
Exceptional
50.2%
Immigrants | Canada
98.7
/100
|
#88
Exceptional
50.1%
Immigrants | Western Europe
98.7
/100
|
#89
Exceptional
50.1%
Immigrants | Ethiopia
98.7
/100
|
#90
Exceptional
50.1%
Immigrants | Western Asia
98.7
/100
|
#91
Exceptional
50.1%
Immigrants | North America
98.7
/100
|
#92
Exceptional
50.1%