Nigerian vs Immigrants from Cabo Verde Family Households
COMPARE
Nigerian
Immigrants from Cabo Verde
Family Households
Family Households Comparison
Nigerians
Immigrants from Cabo Verde
63.9%
FAMILY HOUSEHOLDS
11.5/ 100
METRIC RATING
207th/ 347
METRIC RANK
61.9%
FAMILY HOUSEHOLDS
0.0/ 100
METRIC RATING
314th/ 347
METRIC RANK
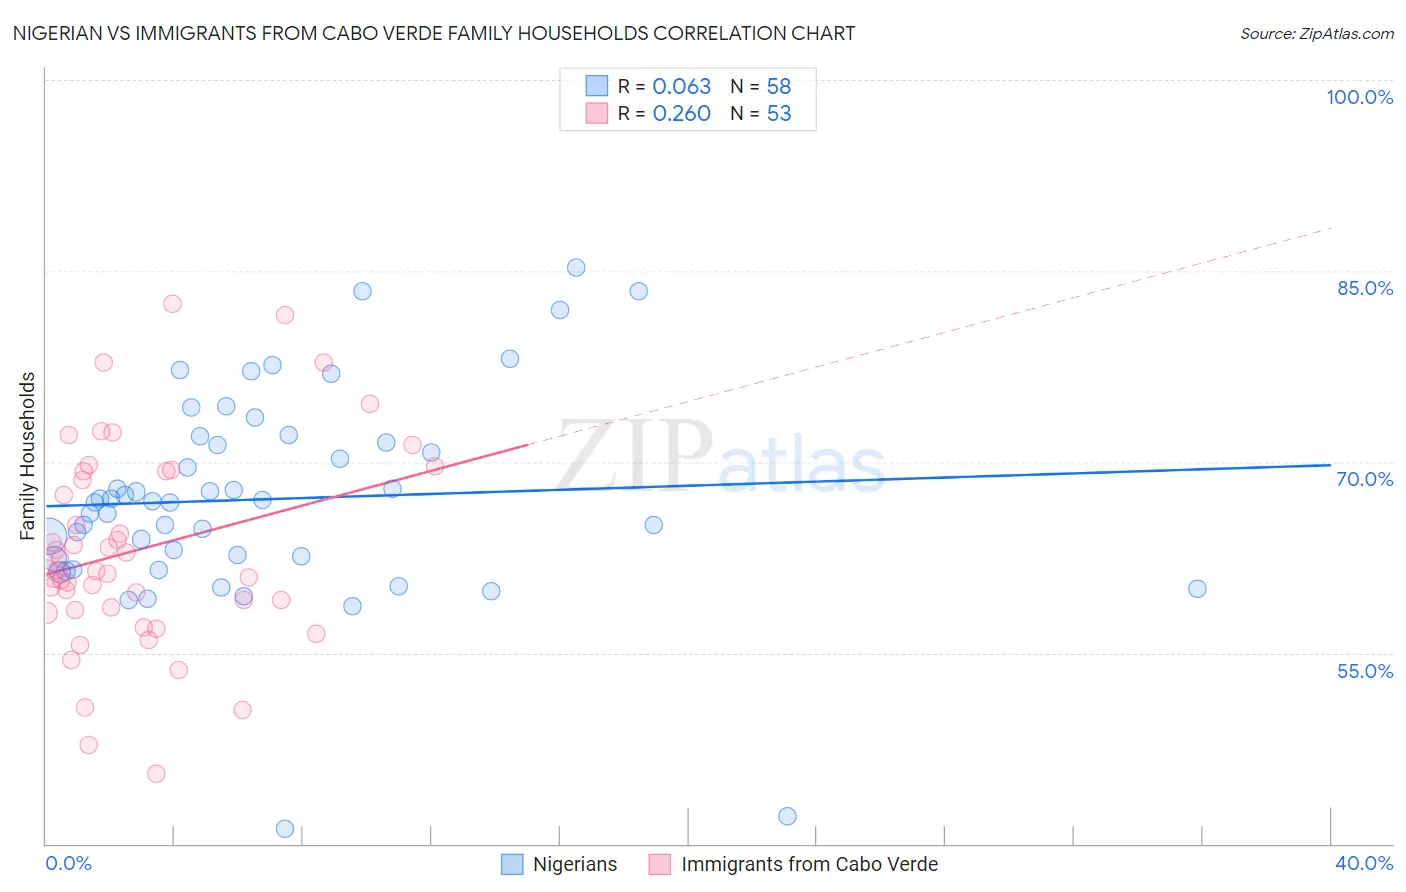
Nigerian vs Immigrants from Cabo Verde Family Households Correlation Chart
The statistical analysis conducted on geographies consisting of 332,466,874 people shows a slight positive correlation between the proportion of Nigerians and percentage of family households in the United States with a correlation coefficient (R) of 0.063 and weighted average of 63.9%. Similarly, the statistical analysis conducted on geographies consisting of 38,135,369 people shows a weak positive correlation between the proportion of Immigrants from Cabo Verde and percentage of family households in the United States with a correlation coefficient (R) of 0.260 and weighted average of 61.9%, a difference of 3.1%.
Family Households Correlation Summary
| Measurement | Nigerian | Immigrants from Cabo Verde |
| Minimum | 41.2% | 45.5% |
| Maximum | 85.2% | 82.5% |
| Range | 44.1% | 37.0% |
| Mean | 67.1% | 63.1% |
| Median | 66.9% | 61.5% |
| Interquartile 25% (IQ1) | 62.4% | 58.5% |
| Interquartile 75% (IQ3) | 71.6% | 69.2% |
| Interquartile Range (IQR) | 9.2% | 10.8% |
| Standard Deviation (Sample) | 8.2% | 7.9% |
| Standard Deviation (Population) | 8.2% | 7.9% |
Similar Demographics by Family Households
Demographics Similar to Nigerians by Family Households
In terms of family households, the demographic groups most similar to Nigerians are Immigrants from Bangladesh (63.9%, a difference of 0.0%), Sierra Leonean (63.9%, a difference of 0.010%), Immigrants from Lithuania (63.9%, a difference of 0.020%), Brazilian (63.9%, a difference of 0.030%), and Immigrants from Uruguay (63.9%, a difference of 0.040%).
| Demographics | Rating | Rank | Family Households |
| Immigrants | Malaysia | 17.9 /100 | #200 | Poor 64.0% |
| Immigrants | Eastern Europe | 17.2 /100 | #201 | Poor 64.0% |
| Iranians | 13.5 /100 | #202 | Poor 63.9% |
| Norwegians | 13.2 /100 | #203 | Poor 63.9% |
| Immigrants | Uruguay | 12.8 /100 | #204 | Poor 63.9% |
| Brazilians | 12.4 /100 | #205 | Poor 63.9% |
| Immigrants | Lithuania | 12.1 /100 | #206 | Poor 63.9% |
| Nigerians | 11.5 /100 | #207 | Poor 63.9% |
| Immigrants | Bangladesh | 11.4 /100 | #208 | Poor 63.9% |
| Sierra Leoneans | 11.2 /100 | #209 | Poor 63.9% |
| Immigrants | Thailand | 9.6 /100 | #210 | Tragic 63.8% |
| Shoshone | 9.4 /100 | #211 | Tragic 63.8% |
| Immigrants | Netherlands | 9.4 /100 | #212 | Tragic 63.8% |
| Immigrants | Northern Europe | 8.8 /100 | #213 | Tragic 63.8% |
| Celtics | 8.0 /100 | #214 | Tragic 63.8% |
Demographics Similar to Immigrants from Cabo Verde by Family Households
In terms of family households, the demographic groups most similar to Immigrants from Cabo Verde are Moroccan (61.9%, a difference of 0.040%), Liberian (62.0%, a difference of 0.050%), Immigrants from Latvia (62.0%, a difference of 0.060%), Immigrants from Middle Africa (61.9%, a difference of 0.080%), and Immigrants from Morocco (62.0%, a difference of 0.10%).
| Demographics | Rating | Rank | Family Households |
| Immigrants | Norway | 0.0 /100 | #307 | Tragic 62.1% |
| Chippewa | 0.0 /100 | #308 | Tragic 62.1% |
| Sub-Saharan Africans | 0.0 /100 | #309 | Tragic 62.1% |
| Immigrants | Liberia | 0.0 /100 | #310 | Tragic 62.0% |
| Immigrants | Morocco | 0.0 /100 | #311 | Tragic 62.0% |
| Immigrants | Latvia | 0.0 /100 | #312 | Tragic 62.0% |
| Liberians | 0.0 /100 | #313 | Tragic 62.0% |
| Immigrants | Cabo Verde | 0.0 /100 | #314 | Tragic 61.9% |
| Moroccans | 0.0 /100 | #315 | Tragic 61.9% |
| Immigrants | Middle Africa | 0.0 /100 | #316 | Tragic 61.9% |
| Immigrants | Bosnia and Herzegovina | 0.0 /100 | #317 | Tragic 61.9% |
| Alaskan Athabascans | 0.0 /100 | #318 | Tragic 61.8% |
| Cape Verdeans | 0.0 /100 | #319 | Tragic 61.8% |
| Ugandans | 0.0 /100 | #320 | Tragic 61.7% |
| Alsatians | 0.0 /100 | #321 | Tragic 61.7% |