Nigerian vs Immigrants from Cabo Verde Median Family Income
COMPARE
Nigerian
Immigrants from Cabo Verde
Median Family Income
Median Family Income Comparison
Nigerians
Immigrants from Cabo Verde
$97,522
MEDIAN FAMILY INCOME
6.7/ 100
METRIC RATING
215th/ 347
METRIC RANK
$87,830
MEDIAN FAMILY INCOME
0.1/ 100
METRIC RATING
291st/ 347
METRIC RANK
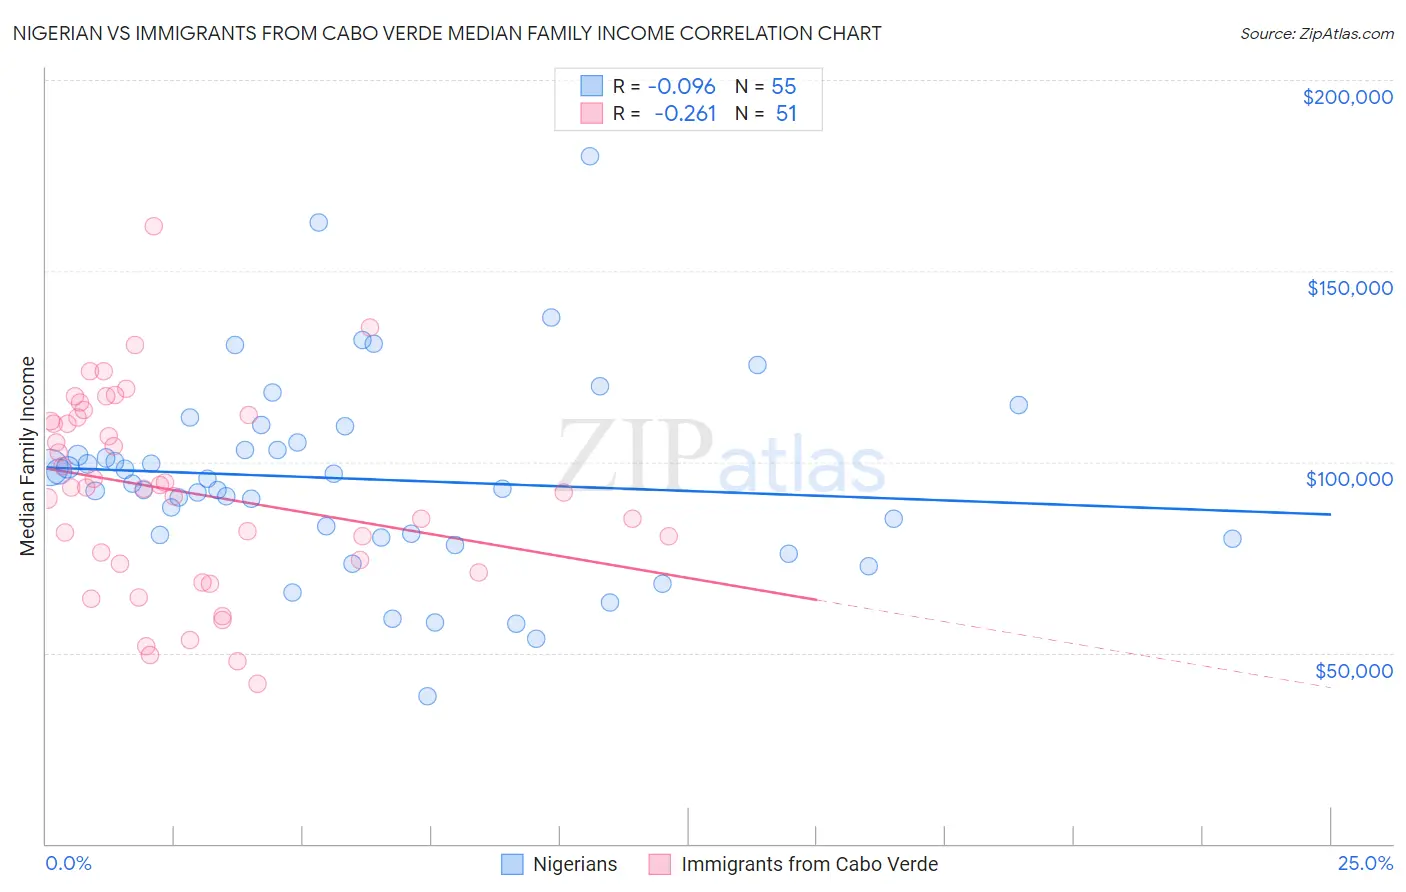
Nigerian vs Immigrants from Cabo Verde Median Family Income Correlation Chart
The statistical analysis conducted on geographies consisting of 332,335,879 people shows a slight negative correlation between the proportion of Nigerians and median family income in the United States with a correlation coefficient (R) of -0.096 and weighted average of $97,522. Similarly, the statistical analysis conducted on geographies consisting of 38,130,720 people shows a weak negative correlation between the proportion of Immigrants from Cabo Verde and median family income in the United States with a correlation coefficient (R) of -0.261 and weighted average of $87,830, a difference of 11.0%.
Median Family Income Correlation Summary
| Measurement | Nigerian | Immigrants from Cabo Verde |
| Minimum | $38,750 | $41,875 |
| Maximum | $179,905 | $161,685 |
| Range | $141,155 | $119,810 |
| Mean | $95,484 | $92,155 |
| Median | $94,247 | $93,152 |
| Interquartile 25% (IQ1) | $80,166 | $73,200 |
| Interquartile 75% (IQ3) | $105,230 | $111,657 |
| Interquartile Range (IQR) | $25,063 | $38,457 |
| Standard Deviation (Sample) | $25,645 | $25,505 |
| Standard Deviation (Population) | $25,411 | $25,254 |
Similar Demographics by Median Family Income
Demographics Similar to Nigerians by Median Family Income
In terms of median family income, the demographic groups most similar to Nigerians are Bermudan ($97,577, a difference of 0.060%), Immigrants from Armenia ($97,605, a difference of 0.090%), Immigrants from Bosnia and Herzegovina ($97,432, a difference of 0.090%), Panamanian ($97,683, a difference of 0.17%), and Immigrants from Sudan ($97,737, a difference of 0.22%).
| Demographics | Rating | Rank | Median Family Income |
| Immigrants | Uruguay | 9.2 /100 | #208 | Tragic $98,205 |
| Immigrants | Colombia | 8.7 /100 | #209 | Tragic $98,067 |
| Puget Sound Salish | 8.2 /100 | #210 | Tragic $97,958 |
| Immigrants | Sudan | 7.4 /100 | #211 | Tragic $97,737 |
| Panamanians | 7.2 /100 | #212 | Tragic $97,683 |
| Immigrants | Armenia | 7.0 /100 | #213 | Tragic $97,605 |
| Bermudans | 6.9 /100 | #214 | Tragic $97,577 |
| Nigerians | 6.7 /100 | #215 | Tragic $97,522 |
| Immigrants | Bosnia and Herzegovina | 6.4 /100 | #216 | Tragic $97,432 |
| Japanese | 6.0 /100 | #217 | Tragic $97,288 |
| Immigrants | Cambodia | 5.8 /100 | #218 | Tragic $97,222 |
| Delaware | 5.1 /100 | #219 | Tragic $96,958 |
| Sudanese | 4.7 /100 | #220 | Tragic $96,783 |
| Immigrants | Ghana | 4.2 /100 | #221 | Tragic $96,544 |
| Immigrants | Nigeria | 4.0 /100 | #222 | Tragic $96,439 |
Demographics Similar to Immigrants from Cabo Verde by Median Family Income
In terms of median family income, the demographic groups most similar to Immigrants from Cabo Verde are African ($87,820, a difference of 0.010%), Shoshone ($87,872, a difference of 0.050%), Central American Indian ($88,034, a difference of 0.23%), Ute ($87,596, a difference of 0.27%), and Cherokee ($88,209, a difference of 0.43%).
| Demographics | Rating | Rank | Median Family Income |
| Indonesians | 0.1 /100 | #284 | Tragic $88,301 |
| Guatemalans | 0.1 /100 | #285 | Tragic $88,295 |
| Immigrants | Nicaragua | 0.1 /100 | #286 | Tragic $88,267 |
| Potawatomi | 0.1 /100 | #287 | Tragic $88,265 |
| Cherokee | 0.1 /100 | #288 | Tragic $88,209 |
| Central American Indians | 0.1 /100 | #289 | Tragic $88,034 |
| Shoshone | 0.1 /100 | #290 | Tragic $87,872 |
| Immigrants | Cabo Verde | 0.1 /100 | #291 | Tragic $87,830 |
| Africans | 0.1 /100 | #292 | Tragic $87,820 |
| Ute | 0.0 /100 | #293 | Tragic $87,596 |
| Fijians | 0.0 /100 | #294 | Tragic $87,387 |
| Yaqui | 0.0 /100 | #295 | Tragic $87,289 |
| Immigrants | Guatemala | 0.0 /100 | #296 | Tragic $87,191 |
| Cajuns | 0.0 /100 | #297 | Tragic $87,157 |
| Immigrants | Latin America | 0.0 /100 | #298 | Tragic $86,989 |