Egyptian vs Immigrants from Cabo Verde Associate's Degree
COMPARE
Egyptian
Immigrants from Cabo Verde
Associate's Degree
Associate's Degree Comparison
Egyptians
Immigrants from Cabo Verde
50.9%
ASSOCIATE'S DEGREE
99.5/ 100
METRIC RATING
69th/ 347
METRIC RANK
36.8%
ASSOCIATE'S DEGREE
0.0/ 100
METRIC RATING
323rd/ 347
METRIC RANK
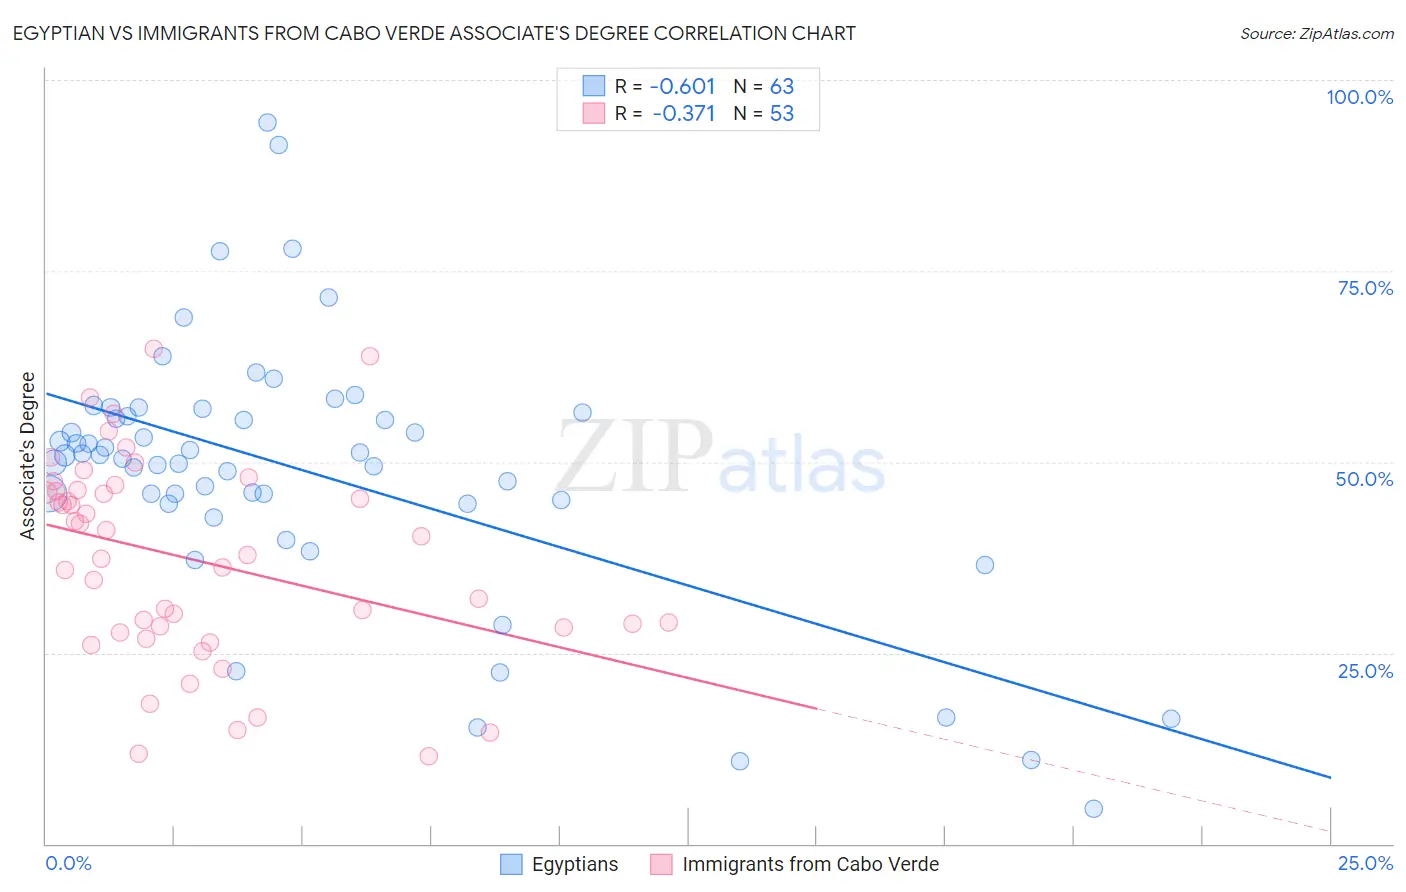
Egyptian vs Immigrants from Cabo Verde Associate's Degree Correlation Chart
The statistical analysis conducted on geographies consisting of 276,910,507 people shows a significant negative correlation between the proportion of Egyptians and percentage of population with at least associate's degree education in the United States with a correlation coefficient (R) of -0.601 and weighted average of 50.9%. Similarly, the statistical analysis conducted on geographies consisting of 38,158,666 people shows a mild negative correlation between the proportion of Immigrants from Cabo Verde and percentage of population with at least associate's degree education in the United States with a correlation coefficient (R) of -0.371 and weighted average of 36.8%, a difference of 38.5%.
Associate's Degree Correlation Summary
| Measurement | Egyptian | Immigrants from Cabo Verde |
| Minimum | 4.6% | 11.5% |
| Maximum | 94.5% | 64.7% |
| Range | 89.9% | 53.3% |
| Mean | 48.7% | 37.2% |
| Median | 50.8% | 37.7% |
| Interquartile 25% (IQ1) | 44.6% | 28.0% |
| Interquartile 75% (IQ3) | 56.5% | 46.2% |
| Interquartile Range (IQR) | 11.9% | 18.3% |
| Standard Deviation (Sample) | 17.2% | 13.1% |
| Standard Deviation (Population) | 17.1% | 13.0% |
Similar Demographics by Associate's Degree
Demographics Similar to Egyptians by Associate's Degree
In terms of associate's degree, the demographic groups most similar to Egyptians are Immigrants from Argentina (50.9%, a difference of 0.030%), Immigrants from Romania (50.9%, a difference of 0.040%), Immigrants from Pakistan (50.9%, a difference of 0.10%), Immigrants from Indonesia (51.0%, a difference of 0.12%), and Carpatho Rusyn (50.6%, a difference of 0.57%).
| Demographics | Rating | Rank | Associate's Degree |
| Bhutanese | 99.7 /100 | #62 | Exceptional 51.4% |
| South Africans | 99.7 /100 | #63 | Exceptional 51.4% |
| Immigrants | Netherlands | 99.7 /100 | #64 | Exceptional 51.4% |
| Zimbabweans | 99.7 /100 | #65 | Exceptional 51.3% |
| Immigrants | Europe | 99.7 /100 | #66 | Exceptional 51.3% |
| Argentineans | 99.6 /100 | #67 | Exceptional 51.2% |
| Immigrants | Indonesia | 99.5 /100 | #68 | Exceptional 51.0% |
| Egyptians | 99.5 /100 | #69 | Exceptional 50.9% |
| Immigrants | Argentina | 99.5 /100 | #70 | Exceptional 50.9% |
| Immigrants | Romania | 99.5 /100 | #71 | Exceptional 50.9% |
| Immigrants | Pakistan | 99.5 /100 | #72 | Exceptional 50.9% |
| Carpatho Rusyns | 99.3 /100 | #73 | Exceptional 50.6% |
| Lithuanians | 99.3 /100 | #74 | Exceptional 50.6% |
| Immigrants | Scotland | 99.3 /100 | #75 | Exceptional 50.6% |
| Immigrants | Zimbabwe | 99.2 /100 | #76 | Exceptional 50.5% |
Demographics Similar to Immigrants from Cabo Verde by Associate's Degree
In terms of associate's degree, the demographic groups most similar to Immigrants from Cabo Verde are Arapaho (36.7%, a difference of 0.16%), Menominee (36.7%, a difference of 0.27%), Kiowa (36.5%, a difference of 0.83%), Dutch West Indian (36.5%, a difference of 0.85%), and Alaskan Athabascan (36.5%, a difference of 0.86%).
| Demographics | Rating | Rank | Associate's Degree |
| Crow | 0.0 /100 | #316 | Tragic 37.6% |
| Yaqui | 0.0 /100 | #317 | Tragic 37.6% |
| Alaska Natives | 0.0 /100 | #318 | Tragic 37.5% |
| Fijians | 0.0 /100 | #319 | Tragic 37.4% |
| Cajuns | 0.0 /100 | #320 | Tragic 37.4% |
| Immigrants | Yemen | 0.0 /100 | #321 | Tragic 37.3% |
| Pennsylvania Germans | 0.0 /100 | #322 | Tragic 37.2% |
| Immigrants | Cabo Verde | 0.0 /100 | #323 | Tragic 36.8% |
| Arapaho | 0.0 /100 | #324 | Tragic 36.7% |
| Menominee | 0.0 /100 | #325 | Tragic 36.7% |
| Kiowa | 0.0 /100 | #326 | Tragic 36.5% |
| Dutch West Indians | 0.0 /100 | #327 | Tragic 36.5% |
| Alaskan Athabascans | 0.0 /100 | #328 | Tragic 36.5% |
| Paiute | 0.0 /100 | #329 | Tragic 36.4% |
| Apache | 0.0 /100 | #330 | Tragic 36.2% |