Nepalese vs Immigrants from Sudan Doctorate Degree
COMPARE
Nepalese
Immigrants from Sudan
Doctorate Degree
Doctorate Degree Comparison
Nepalese
Immigrants from Sudan
1.3%
DOCTORATE DEGREE
0.0/ 100
METRIC RATING
336th/ 347
METRIC RANK
2.2%
DOCTORATE DEGREE
99.1/ 100
METRIC RATING
91st/ 347
METRIC RANK
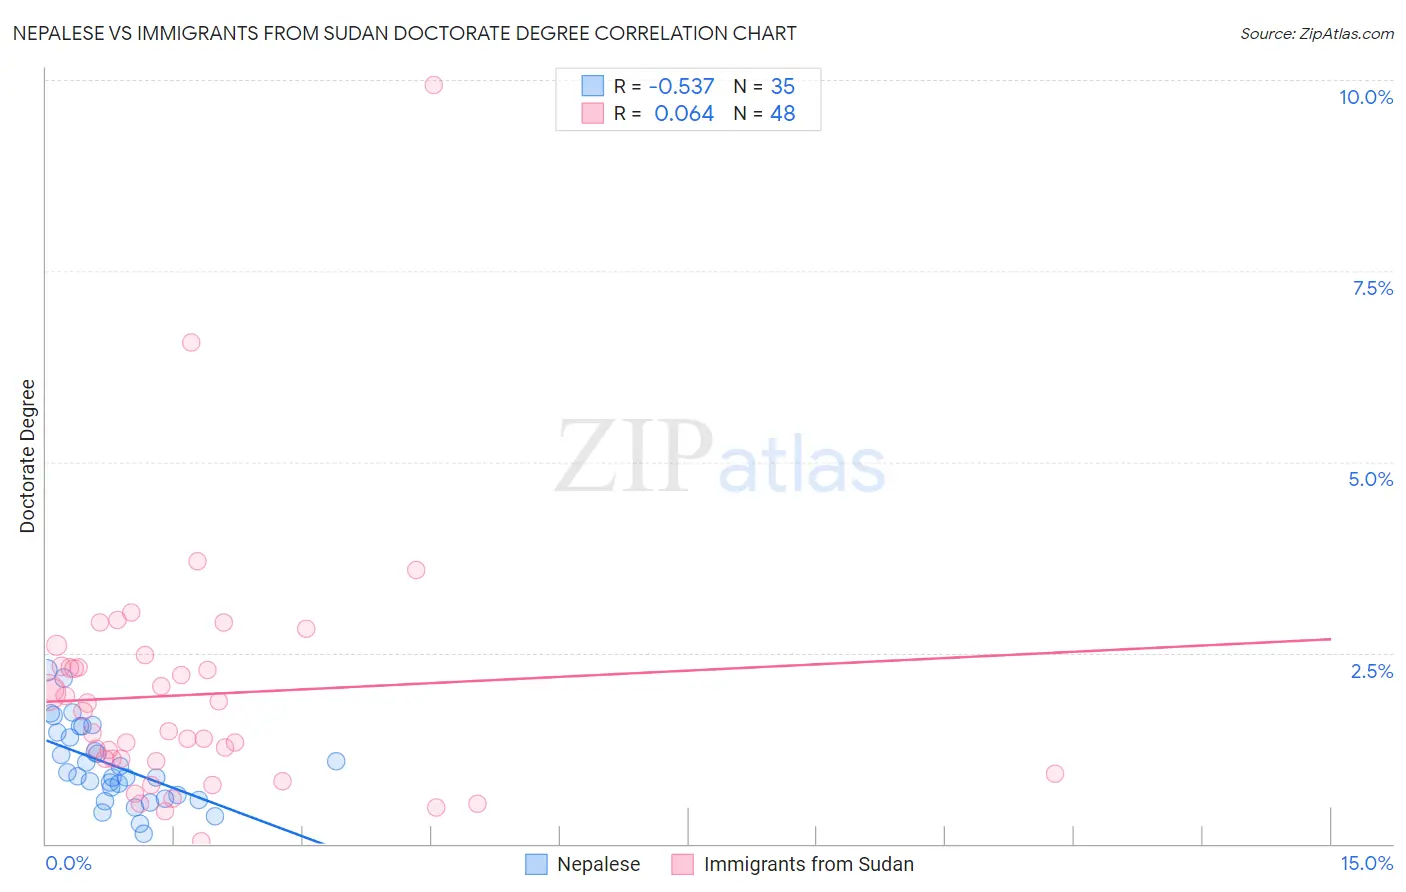
Nepalese vs Immigrants from Sudan Doctorate Degree Correlation Chart
The statistical analysis conducted on geographies consisting of 24,454,605 people shows a substantial negative correlation between the proportion of Nepalese and percentage of population with at least doctorate degree education in the United States with a correlation coefficient (R) of -0.537 and weighted average of 1.3%. Similarly, the statistical analysis conducted on geographies consisting of 118,716,469 people shows a slight positive correlation between the proportion of Immigrants from Sudan and percentage of population with at least doctorate degree education in the United States with a correlation coefficient (R) of 0.064 and weighted average of 2.2%, a difference of 72.1%.
Doctorate Degree Correlation Summary
| Measurement | Nepalese | Immigrants from Sudan |
| Minimum | 0.13% | 0.039% |
| Maximum | 2.3% | 9.9% |
| Range | 2.1% | 9.9% |
| Mean | 1.0% | 1.9% |
| Median | 0.89% | 1.6% |
| Interquartile 25% (IQ1) | 0.59% | 1.1% |
| Interquartile 75% (IQ3) | 1.5% | 2.3% |
| Interquartile Range (IQR) | 0.87% | 1.2% |
| Standard Deviation (Sample) | 0.52% | 1.6% |
| Standard Deviation (Population) | 0.51% | 1.6% |
Similar Demographics by Doctorate Degree
Demographics Similar to Nepalese by Doctorate Degree
In terms of doctorate degree, the demographic groups most similar to Nepalese are Immigrants from Haiti (1.3%, a difference of 0.23%), Immigrants from Dominican Republic (1.3%, a difference of 2.0%), Immigrants from Caribbean (1.3%, a difference of 2.2%), Yakama (1.3%, a difference of 2.4%), and Bangladeshi (1.2%, a difference of 3.5%).
| Demographics | Rating | Rank | Doctorate Degree |
| Haitians | 0.0 /100 | #329 | Tragic 1.3% |
| Yup'ik | 0.0 /100 | #330 | Tragic 1.3% |
| Immigrants | Latin America | 0.0 /100 | #331 | Tragic 1.3% |
| Yakama | 0.0 /100 | #332 | Tragic 1.3% |
| Immigrants | Caribbean | 0.0 /100 | #333 | Tragic 1.3% |
| Immigrants | Dominican Republic | 0.0 /100 | #334 | Tragic 1.3% |
| Immigrants | Haiti | 0.0 /100 | #335 | Tragic 1.3% |
| Nepalese | 0.0 /100 | #336 | Tragic 1.3% |
| Bangladeshis | 0.0 /100 | #337 | Tragic 1.2% |
| Puget Sound Salish | 0.0 /100 | #338 | Tragic 1.2% |
| Immigrants | Central America | 0.0 /100 | #339 | Tragic 1.2% |
| Immigrants | Cuba | 0.0 /100 | #340 | Tragic 1.2% |
| Mexicans | 0.0 /100 | #341 | Tragic 1.2% |
| Arapaho | 0.0 /100 | #342 | Tragic 1.2% |
| Fijians | 0.0 /100 | #343 | Tragic 1.1% |
Demographics Similar to Immigrants from Sudan by Doctorate Degree
In terms of doctorate degree, the demographic groups most similar to Immigrants from Sudan are Chilean (2.2%, a difference of 0.26%), Immigrants from Scotland (2.2%, a difference of 0.47%), Alsatian (2.1%, a difference of 0.48%), British (2.2%, a difference of 0.49%), and Immigrants from Nepal (2.2%, a difference of 0.93%).
| Demographics | Rating | Rank | Doctorate Degree |
| Immigrants | England | 99.6 /100 | #84 | Exceptional 2.2% |
| Immigrants | Brazil | 99.6 /100 | #85 | Exceptional 2.2% |
| Egyptians | 99.4 /100 | #86 | Exceptional 2.2% |
| Immigrants | Zimbabwe | 99.4 /100 | #87 | Exceptional 2.2% |
| Immigrants | Nepal | 99.3 /100 | #88 | Exceptional 2.2% |
| British | 99.3 /100 | #89 | Exceptional 2.2% |
| Immigrants | Scotland | 99.2 /100 | #90 | Exceptional 2.2% |
| Immigrants | Sudan | 99.1 /100 | #91 | Exceptional 2.2% |
| Chileans | 99.1 /100 | #92 | Exceptional 2.2% |
| Alsatians | 99.0 /100 | #93 | Exceptional 2.1% |
| Greeks | 98.8 /100 | #94 | Exceptional 2.1% |
| Immigrants | Romania | 98.7 /100 | #95 | Exceptional 2.1% |
| Immigrants | Northern Africa | 98.4 /100 | #96 | Exceptional 2.1% |
| Immigrants | Eritrea | 98.4 /100 | #97 | Exceptional 2.1% |
| Armenians | 98.3 /100 | #98 | Exceptional 2.1% |