Romanian vs Immigrants from Sudan Doctorate Degree
COMPARE
Romanian
Immigrants from Sudan
Doctorate Degree
Doctorate Degree Comparison
Romanians
Immigrants from Sudan
2.1%
DOCTORATE DEGREE
98.1/ 100
METRIC RATING
103rd/ 347
METRIC RANK
2.2%
DOCTORATE DEGREE
99.1/ 100
METRIC RATING
91st/ 347
METRIC RANK
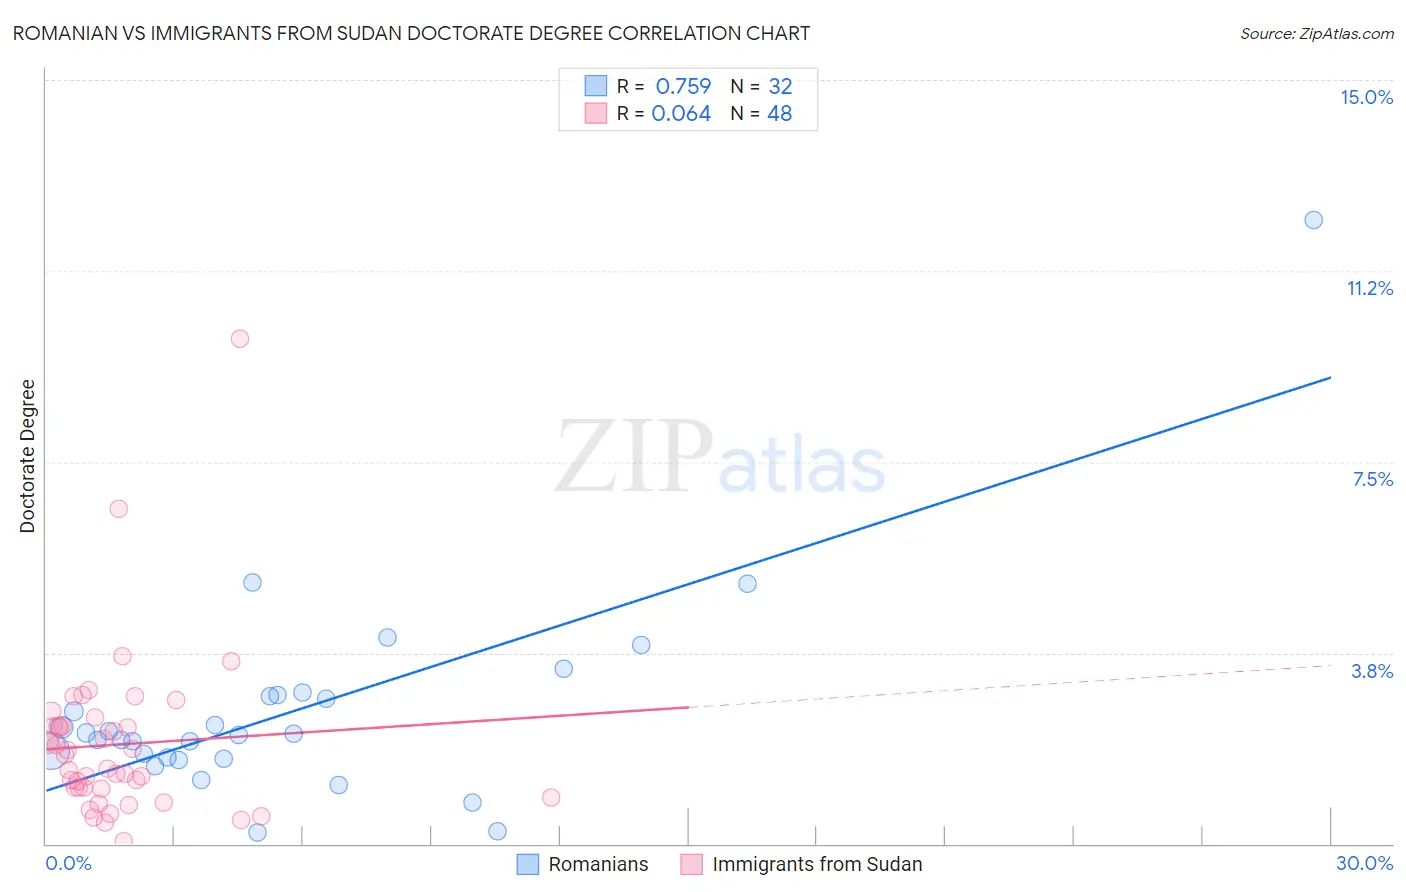
Romanian vs Immigrants from Sudan Doctorate Degree Correlation Chart
The statistical analysis conducted on geographies consisting of 374,979,448 people shows a strong positive correlation between the proportion of Romanians and percentage of population with at least doctorate degree education in the United States with a correlation coefficient (R) of 0.759 and weighted average of 2.1%. Similarly, the statistical analysis conducted on geographies consisting of 118,716,469 people shows a slight positive correlation between the proportion of Immigrants from Sudan and percentage of population with at least doctorate degree education in the United States with a correlation coefficient (R) of 0.064 and weighted average of 2.2%, a difference of 2.5%.
Doctorate Degree Correlation Summary
| Measurement | Romanian | Immigrants from Sudan |
| Minimum | 0.21% | 0.039% |
| Maximum | 12.2% | 9.9% |
| Range | 12.0% | 9.9% |
| Mean | 2.6% | 1.9% |
| Median | 2.1% | 1.6% |
| Interquartile 25% (IQ1) | 1.7% | 1.1% |
| Interquartile 75% (IQ3) | 2.9% | 2.3% |
| Interquartile Range (IQR) | 1.2% | 1.2% |
| Standard Deviation (Sample) | 2.1% | 1.6% |
| Standard Deviation (Population) | 2.1% | 1.6% |
Demographics Similar to Romanians and Immigrants from Sudan by Doctorate Degree
In terms of doctorate degree, the demographic groups most similar to Romanians are Immigrants from Chile (2.1%, a difference of 0.010%), Austrian (2.1%, a difference of 0.12%), Immigrants from Eastern Africa (2.1%, a difference of 0.23%), Immigrants from Eastern Europe (2.1%, a difference of 0.26%), and Immigrants from Egypt (2.1%, a difference of 0.27%). Similarly, the demographic groups most similar to Immigrants from Sudan are Chilean (2.2%, a difference of 0.26%), Immigrants from Scotland (2.2%, a difference of 0.47%), Alsatian (2.1%, a difference of 0.48%), British (2.2%, a difference of 0.49%), and Immigrants from Nepal (2.2%, a difference of 0.93%).
| Demographics | Rating | Rank | Doctorate Degree |
| Immigrants | Zimbabwe | 99.4 /100 | #87 | Exceptional 2.2% |
| Immigrants | Nepal | 99.3 /100 | #88 | Exceptional 2.2% |
| British | 99.3 /100 | #89 | Exceptional 2.2% |
| Immigrants | Scotland | 99.2 /100 | #90 | Exceptional 2.2% |
| Immigrants | Sudan | 99.1 /100 | #91 | Exceptional 2.2% |
| Chileans | 99.1 /100 | #92 | Exceptional 2.2% |
| Alsatians | 99.0 /100 | #93 | Exceptional 2.1% |
| Greeks | 98.8 /100 | #94 | Exceptional 2.1% |
| Immigrants | Romania | 98.7 /100 | #95 | Exceptional 2.1% |
| Immigrants | Northern Africa | 98.4 /100 | #96 | Exceptional 2.1% |
| Immigrants | Eritrea | 98.4 /100 | #97 | Exceptional 2.1% |
| Armenians | 98.3 /100 | #98 | Exceptional 2.1% |
| Immigrants | Egypt | 98.2 /100 | #99 | Exceptional 2.1% |
| Immigrants | Eastern Europe | 98.2 /100 | #100 | Exceptional 2.1% |
| Immigrants | Eastern Africa | 98.2 /100 | #101 | Exceptional 2.1% |
| Immigrants | Chile | 98.1 /100 | #102 | Exceptional 2.1% |
| Romanians | 98.1 /100 | #103 | Exceptional 2.1% |
| Austrians | 98.0 /100 | #104 | Exceptional 2.1% |
| Arabs | 97.8 /100 | #105 | Exceptional 2.1% |
| Sudanese | 97.7 /100 | #106 | Exceptional 2.1% |
| Europeans | 97.5 /100 | #107 | Exceptional 2.1% |