Nepalese vs Dutch West Indian Doctorate Degree
COMPARE
Nepalese
Dutch West Indian
Doctorate Degree
Doctorate Degree Comparison
Nepalese
Dutch West Indians
1.3%
DOCTORATE DEGREE
0.0/ 100
METRIC RATING
336th/ 347
METRIC RANK
1.3%
DOCTORATE DEGREE
0.1/ 100
METRIC RATING
321st/ 347
METRIC RANK
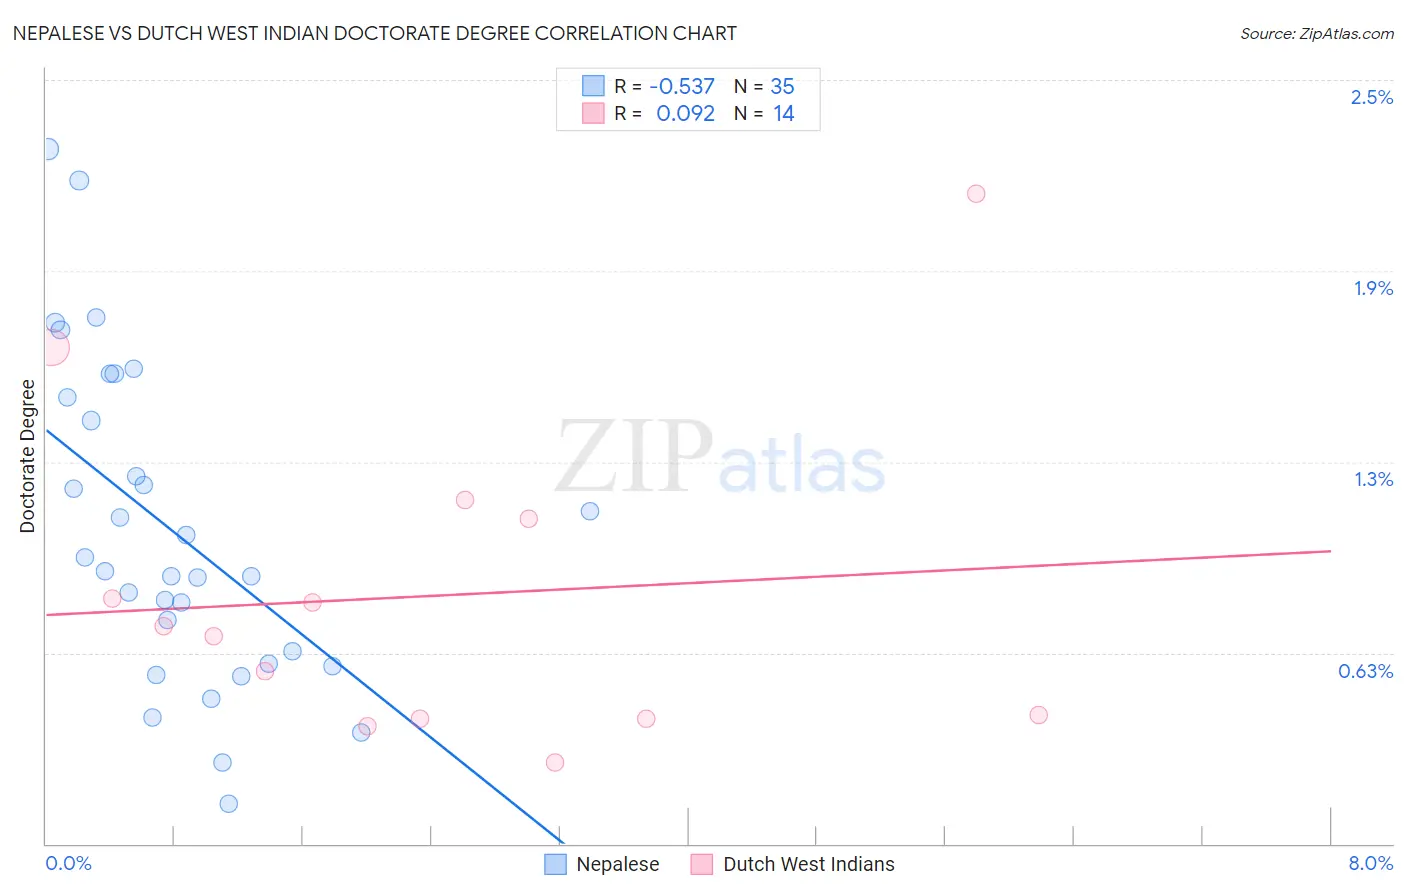
Nepalese vs Dutch West Indian Doctorate Degree Correlation Chart
The statistical analysis conducted on geographies consisting of 24,454,605 people shows a substantial negative correlation between the proportion of Nepalese and percentage of population with at least doctorate degree education in the United States with a correlation coefficient (R) of -0.537 and weighted average of 1.3%. Similarly, the statistical analysis conducted on geographies consisting of 84,429,780 people shows a slight positive correlation between the proportion of Dutch West Indians and percentage of population with at least doctorate degree education in the United States with a correlation coefficient (R) of 0.092 and weighted average of 1.3%, a difference of 6.2%.
Doctorate Degree Correlation Summary
| Measurement | Nepalese | Dutch West Indian |
| Minimum | 0.13% | 0.26% |
| Maximum | 2.3% | 2.1% |
| Range | 2.1% | 1.9% |
| Mean | 1.0% | 0.81% |
| Median | 0.89% | 0.70% |
| Interquartile 25% (IQ1) | 0.59% | 0.41% |
| Interquartile 75% (IQ3) | 1.5% | 1.1% |
| Interquartile Range (IQR) | 0.87% | 0.65% |
| Standard Deviation (Sample) | 0.52% | 0.53% |
| Standard Deviation (Population) | 0.51% | 0.51% |
Demographics Similar to Nepalese and Dutch West Indians by Doctorate Degree
In terms of doctorate degree, the demographic groups most similar to Nepalese are Immigrants from Haiti (1.3%, a difference of 0.23%), Immigrants from Dominican Republic (1.3%, a difference of 2.0%), Immigrants from Caribbean (1.3%, a difference of 2.2%), Yakama (1.3%, a difference of 2.4%), and Bangladeshi (1.2%, a difference of 3.5%). Similarly, the demographic groups most similar to Dutch West Indians are Seminole (1.3%, a difference of 0.060%), Immigrants from St. Vincent and the Grenadines (1.3%, a difference of 0.11%), Immigrants from Guyana (1.3%, a difference of 0.17%), Immigrants from Belize (1.3%, a difference of 0.26%), and Native/Alaskan (1.3%, a difference of 0.58%).
| Demographics | Rating | Rank | Doctorate Degree |
| Creek | 0.1 /100 | #318 | Tragic 1.3% |
| Immigrants | Guyana | 0.1 /100 | #319 | Tragic 1.3% |
| Immigrants | St. Vincent and the Grenadines | 0.1 /100 | #320 | Tragic 1.3% |
| Dutch West Indians | 0.1 /100 | #321 | Tragic 1.3% |
| Seminole | 0.1 /100 | #322 | Tragic 1.3% |
| Immigrants | Belize | 0.1 /100 | #323 | Tragic 1.3% |
| Natives/Alaskans | 0.0 /100 | #324 | Tragic 1.3% |
| Pima | 0.0 /100 | #325 | Tragic 1.3% |
| Immigrants | Cabo Verde | 0.0 /100 | #326 | Tragic 1.3% |
| Hispanics or Latinos | 0.0 /100 | #327 | Tragic 1.3% |
| Inupiat | 0.0 /100 | #328 | Tragic 1.3% |
| Haitians | 0.0 /100 | #329 | Tragic 1.3% |
| Yup'ik | 0.0 /100 | #330 | Tragic 1.3% |
| Immigrants | Latin America | 0.0 /100 | #331 | Tragic 1.3% |
| Yakama | 0.0 /100 | #332 | Tragic 1.3% |
| Immigrants | Caribbean | 0.0 /100 | #333 | Tragic 1.3% |
| Immigrants | Dominican Republic | 0.0 /100 | #334 | Tragic 1.3% |
| Immigrants | Haiti | 0.0 /100 | #335 | Tragic 1.3% |
| Nepalese | 0.0 /100 | #336 | Tragic 1.3% |
| Bangladeshis | 0.0 /100 | #337 | Tragic 1.2% |
| Puget Sound Salish | 0.0 /100 | #338 | Tragic 1.2% |