Nepalese vs Immigrants from Spain Doctorate Degree
COMPARE
Nepalese
Immigrants from Spain
Doctorate Degree
Doctorate Degree Comparison
Nepalese
Immigrants from Spain
1.3%
DOCTORATE DEGREE
0.0/ 100
METRIC RATING
336th/ 347
METRIC RANK
2.6%
DOCTORATE DEGREE
100.0/ 100
METRIC RATING
36th/ 347
METRIC RANK
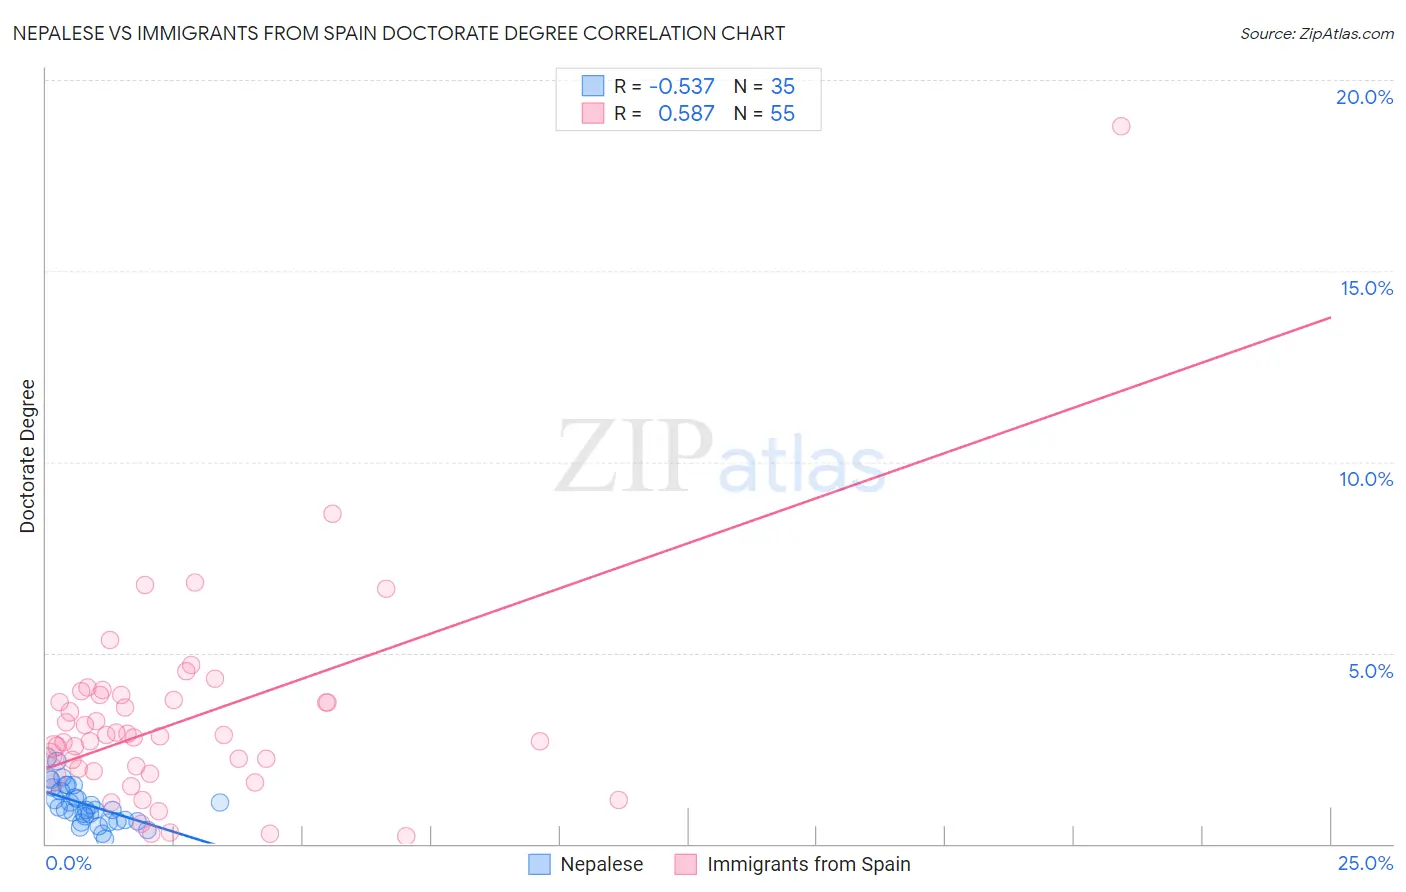
Nepalese vs Immigrants from Spain Doctorate Degree Correlation Chart
The statistical analysis conducted on geographies consisting of 24,454,605 people shows a substantial negative correlation between the proportion of Nepalese and percentage of population with at least doctorate degree education in the United States with a correlation coefficient (R) of -0.537 and weighted average of 1.3%. Similarly, the statistical analysis conducted on geographies consisting of 238,840,570 people shows a substantial positive correlation between the proportion of Immigrants from Spain and percentage of population with at least doctorate degree education in the United States with a correlation coefficient (R) of 0.587 and weighted average of 2.6%, a difference of 104.4%.
Doctorate Degree Correlation Summary
| Measurement | Nepalese | Immigrants from Spain |
| Minimum | 0.13% | 0.19% |
| Maximum | 2.3% | 18.8% |
| Range | 2.1% | 18.6% |
| Mean | 1.0% | 3.2% |
| Median | 0.89% | 2.8% |
| Interquartile 25% (IQ1) | 0.59% | 1.9% |
| Interquartile 75% (IQ3) | 1.5% | 3.9% |
| Interquartile Range (IQR) | 0.87% | 2.0% |
| Standard Deviation (Sample) | 0.52% | 2.7% |
| Standard Deviation (Population) | 0.51% | 2.7% |
Similar Demographics by Doctorate Degree
Demographics Similar to Nepalese by Doctorate Degree
In terms of doctorate degree, the demographic groups most similar to Nepalese are Immigrants from Haiti (1.3%, a difference of 0.23%), Immigrants from Dominican Republic (1.3%, a difference of 2.0%), Immigrants from Caribbean (1.3%, a difference of 2.2%), Yakama (1.3%, a difference of 2.4%), and Bangladeshi (1.2%, a difference of 3.5%).
| Demographics | Rating | Rank | Doctorate Degree |
| Haitians | 0.0 /100 | #329 | Tragic 1.3% |
| Yup'ik | 0.0 /100 | #330 | Tragic 1.3% |
| Immigrants | Latin America | 0.0 /100 | #331 | Tragic 1.3% |
| Yakama | 0.0 /100 | #332 | Tragic 1.3% |
| Immigrants | Caribbean | 0.0 /100 | #333 | Tragic 1.3% |
| Immigrants | Dominican Republic | 0.0 /100 | #334 | Tragic 1.3% |
| Immigrants | Haiti | 0.0 /100 | #335 | Tragic 1.3% |
| Nepalese | 0.0 /100 | #336 | Tragic 1.3% |
| Bangladeshis | 0.0 /100 | #337 | Tragic 1.2% |
| Puget Sound Salish | 0.0 /100 | #338 | Tragic 1.2% |
| Immigrants | Central America | 0.0 /100 | #339 | Tragic 1.2% |
| Immigrants | Cuba | 0.0 /100 | #340 | Tragic 1.2% |
| Mexicans | 0.0 /100 | #341 | Tragic 1.2% |
| Arapaho | 0.0 /100 | #342 | Tragic 1.2% |
| Fijians | 0.0 /100 | #343 | Tragic 1.1% |
Demographics Similar to Immigrants from Spain by Doctorate Degree
In terms of doctorate degree, the demographic groups most similar to Immigrants from Spain are Immigrants from Malaysia (2.6%, a difference of 0.060%), Cypriot (2.6%, a difference of 0.12%), Cambodian (2.6%, a difference of 0.23%), Immigrants from Kuwait (2.6%, a difference of 0.26%), and Immigrants from Northern Europe (2.6%, a difference of 0.41%).
| Demographics | Rating | Rank | Doctorate Degree |
| Immigrants | South Central Asia | 100.0 /100 | #29 | Exceptional 2.6% |
| Immigrants | Korea | 100.0 /100 | #30 | Exceptional 2.6% |
| Latvians | 100.0 /100 | #31 | Exceptional 2.6% |
| Immigrants | Northern Europe | 100.0 /100 | #32 | Exceptional 2.6% |
| Cambodians | 100.0 /100 | #33 | Exceptional 2.6% |
| Cypriots | 100.0 /100 | #34 | Exceptional 2.6% |
| Immigrants | Malaysia | 100.0 /100 | #35 | Exceptional 2.6% |
| Immigrants | Spain | 100.0 /100 | #36 | Exceptional 2.6% |
| Immigrants | Kuwait | 100.0 /100 | #37 | Exceptional 2.6% |
| Russians | 100.0 /100 | #38 | Exceptional 2.6% |
| Immigrants | Ireland | 100.0 /100 | #39 | Exceptional 2.5% |
| Estonians | 100.0 /100 | #40 | Exceptional 2.5% |
| Immigrants | Russia | 100.0 /100 | #41 | Exceptional 2.5% |
| New Zealanders | 100.0 /100 | #42 | Exceptional 2.5% |
| Soviet Union | 100.0 /100 | #43 | Exceptional 2.5% |