Native Hawaiian vs Immigrants from Sudan Doctorate Degree
COMPARE
Native Hawaiian
Immigrants from Sudan
Doctorate Degree
Doctorate Degree Comparison
Native Hawaiians
Immigrants from Sudan
1.6%
DOCTORATE DEGREE
2.1/ 100
METRIC RATING
243rd/ 347
METRIC RANK
2.2%
DOCTORATE DEGREE
99.1/ 100
METRIC RATING
91st/ 347
METRIC RANK
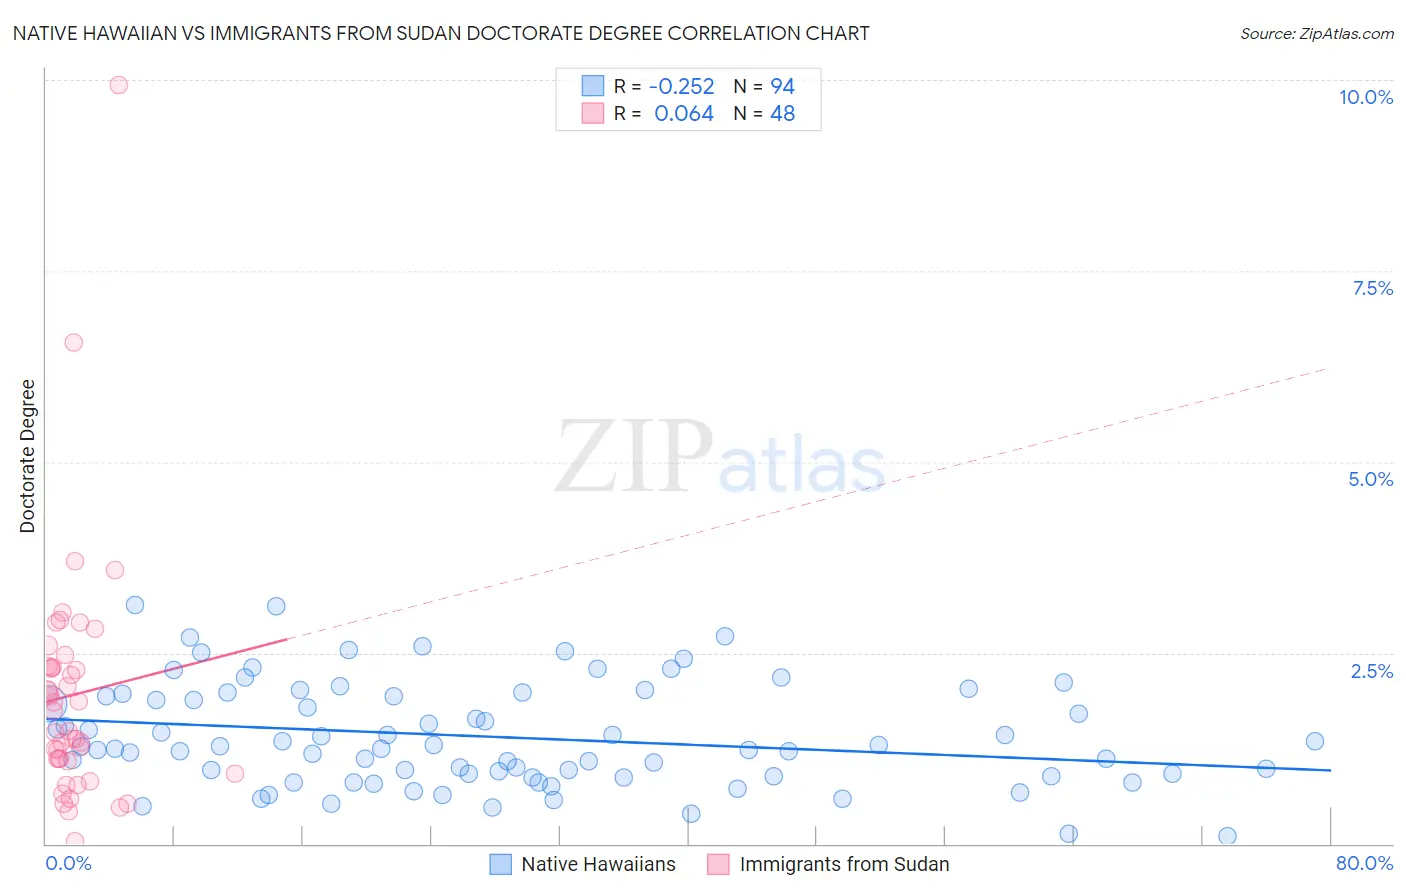
Native Hawaiian vs Immigrants from Sudan Doctorate Degree Correlation Chart
The statistical analysis conducted on geographies consisting of 328,309,931 people shows a weak negative correlation between the proportion of Native Hawaiians and percentage of population with at least doctorate degree education in the United States with a correlation coefficient (R) of -0.252 and weighted average of 1.6%. Similarly, the statistical analysis conducted on geographies consisting of 118,716,469 people shows a slight positive correlation between the proportion of Immigrants from Sudan and percentage of population with at least doctorate degree education in the United States with a correlation coefficient (R) of 0.064 and weighted average of 2.2%, a difference of 36.5%.
Doctorate Degree Correlation Summary
| Measurement | Native Hawaiian | Immigrants from Sudan |
| Minimum | 0.092% | 0.039% |
| Maximum | 3.1% | 9.9% |
| Range | 3.0% | 9.9% |
| Mean | 1.4% | 1.9% |
| Median | 1.3% | 1.6% |
| Interquartile 25% (IQ1) | 0.89% | 1.1% |
| Interquartile 75% (IQ3) | 1.9% | 2.3% |
| Interquartile Range (IQR) | 1.1% | 1.2% |
| Standard Deviation (Sample) | 0.67% | 1.6% |
| Standard Deviation (Population) | 0.67% | 1.6% |
Similar Demographics by Doctorate Degree
Demographics Similar to Native Hawaiians by Doctorate Degree
In terms of doctorate degree, the demographic groups most similar to Native Hawaiians are Ottawa (1.6%, a difference of 0.13%), French American Indian (1.6%, a difference of 0.19%), Cheyenne (1.6%, a difference of 0.34%), Immigrants from Panama (1.6%, a difference of 0.53%), and Delaware (1.6%, a difference of 0.57%).
| Demographics | Rating | Rank | Doctorate Degree |
| Indonesians | 2.8 /100 | #236 | Tragic 1.6% |
| Iroquois | 2.7 /100 | #237 | Tragic 1.6% |
| Immigrants | Congo | 2.6 /100 | #238 | Tragic 1.6% |
| West Indians | 2.5 /100 | #239 | Tragic 1.6% |
| Immigrants | Panama | 2.4 /100 | #240 | Tragic 1.6% |
| Cheyenne | 2.3 /100 | #241 | Tragic 1.6% |
| Ottawa | 2.2 /100 | #242 | Tragic 1.6% |
| Native Hawaiians | 2.1 /100 | #243 | Tragic 1.6% |
| French American Indians | 2.0 /100 | #244 | Tragic 1.6% |
| Delaware | 1.9 /100 | #245 | Tragic 1.6% |
| Hmong | 1.8 /100 | #246 | Tragic 1.6% |
| Comanche | 1.8 /100 | #247 | Tragic 1.6% |
| Africans | 1.8 /100 | #248 | Tragic 1.6% |
| Potawatomi | 1.6 /100 | #249 | Tragic 1.6% |
| Immigrants | Fiji | 1.6 /100 | #250 | Tragic 1.6% |
Demographics Similar to Immigrants from Sudan by Doctorate Degree
In terms of doctorate degree, the demographic groups most similar to Immigrants from Sudan are Chilean (2.2%, a difference of 0.26%), Immigrants from Scotland (2.2%, a difference of 0.47%), Alsatian (2.1%, a difference of 0.48%), British (2.2%, a difference of 0.49%), and Immigrants from Nepal (2.2%, a difference of 0.93%).
| Demographics | Rating | Rank | Doctorate Degree |
| Immigrants | England | 99.6 /100 | #84 | Exceptional 2.2% |
| Immigrants | Brazil | 99.6 /100 | #85 | Exceptional 2.2% |
| Egyptians | 99.4 /100 | #86 | Exceptional 2.2% |
| Immigrants | Zimbabwe | 99.4 /100 | #87 | Exceptional 2.2% |
| Immigrants | Nepal | 99.3 /100 | #88 | Exceptional 2.2% |
| British | 99.3 /100 | #89 | Exceptional 2.2% |
| Immigrants | Scotland | 99.2 /100 | #90 | Exceptional 2.2% |
| Immigrants | Sudan | 99.1 /100 | #91 | Exceptional 2.2% |
| Chileans | 99.1 /100 | #92 | Exceptional 2.2% |
| Alsatians | 99.0 /100 | #93 | Exceptional 2.1% |
| Greeks | 98.8 /100 | #94 | Exceptional 2.1% |
| Immigrants | Romania | 98.7 /100 | #95 | Exceptional 2.1% |
| Immigrants | Northern Africa | 98.4 /100 | #96 | Exceptional 2.1% |
| Immigrants | Eritrea | 98.4 /100 | #97 | Exceptional 2.1% |
| Armenians | 98.3 /100 | #98 | Exceptional 2.1% |