Ghanaian vs Immigrants from Sudan Doctorate Degree
COMPARE
Ghanaian
Immigrants from Sudan
Doctorate Degree
Doctorate Degree Comparison
Ghanaians
Immigrants from Sudan
1.8%
DOCTORATE DEGREE
48.3/ 100
METRIC RATING
179th/ 347
METRIC RANK
2.2%
DOCTORATE DEGREE
99.1/ 100
METRIC RATING
91st/ 347
METRIC RANK
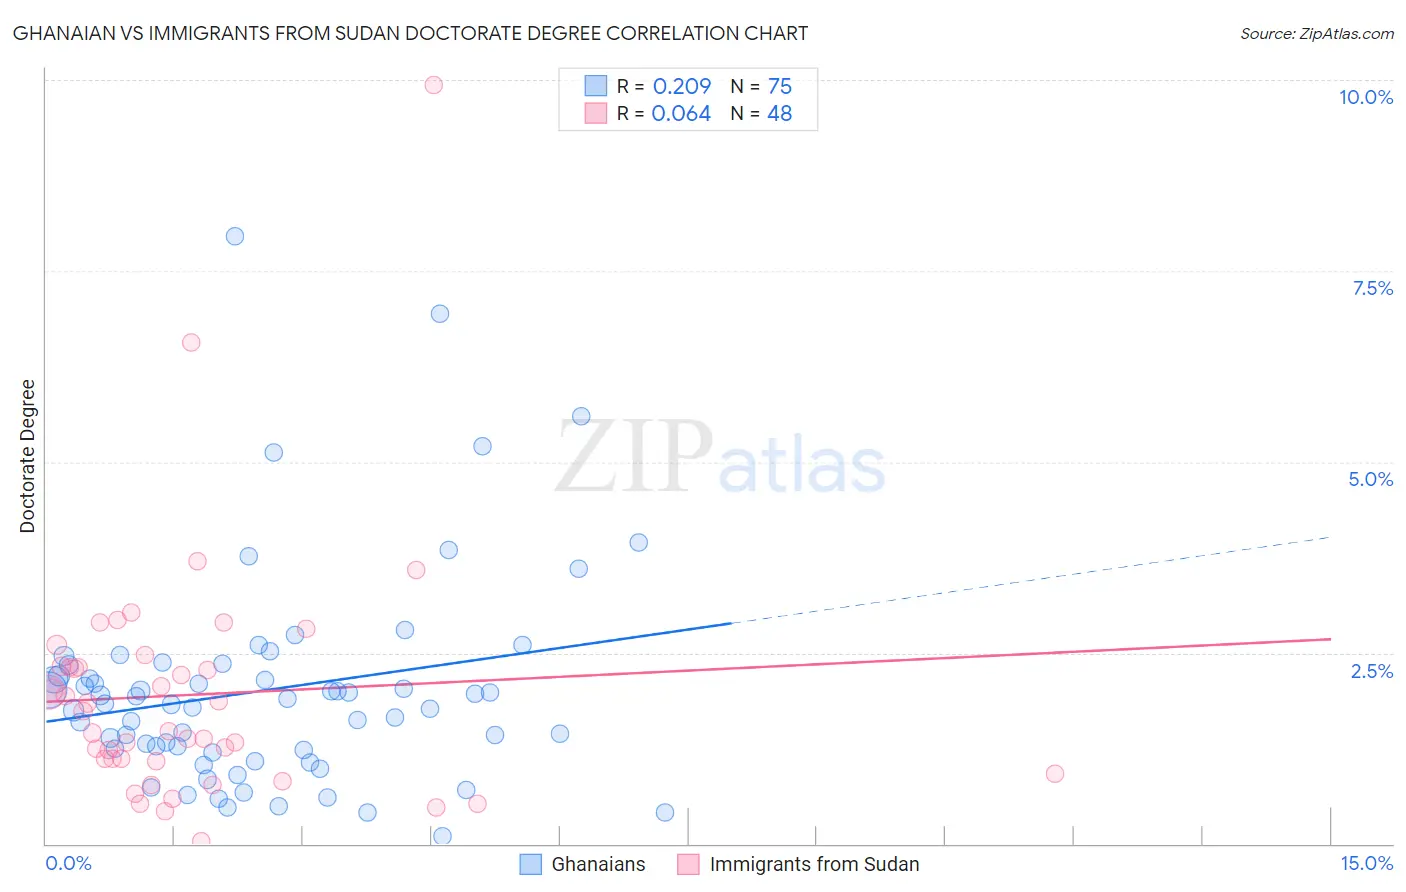
Ghanaian vs Immigrants from Sudan Doctorate Degree Correlation Chart
The statistical analysis conducted on geographies consisting of 190,123,841 people shows a weak positive correlation between the proportion of Ghanaians and percentage of population with at least doctorate degree education in the United States with a correlation coefficient (R) of 0.209 and weighted average of 1.8%. Similarly, the statistical analysis conducted on geographies consisting of 118,716,469 people shows a slight positive correlation between the proportion of Immigrants from Sudan and percentage of population with at least doctorate degree education in the United States with a correlation coefficient (R) of 0.064 and weighted average of 2.2%, a difference of 17.6%.
Doctorate Degree Correlation Summary
| Measurement | Ghanaian | Immigrants from Sudan |
| Minimum | 0.098% | 0.039% |
| Maximum | 8.0% | 9.9% |
| Range | 7.9% | 9.9% |
| Mean | 2.0% | 1.9% |
| Median | 1.8% | 1.6% |
| Interquartile 25% (IQ1) | 1.2% | 1.1% |
| Interquartile 75% (IQ3) | 2.3% | 2.3% |
| Interquartile Range (IQR) | 1.1% | 1.2% |
| Standard Deviation (Sample) | 1.4% | 1.6% |
| Standard Deviation (Population) | 1.4% | 1.6% |
Similar Demographics by Doctorate Degree
Demographics Similar to Ghanaians by Doctorate Degree
In terms of doctorate degree, the demographic groups most similar to Ghanaians are Scandinavian (1.8%, a difference of 0.050%), French (1.8%, a difference of 0.070%), Iraqi (1.8%, a difference of 0.13%), Spanish (1.8%, a difference of 0.15%), and Immigrants from Thailand (1.8%, a difference of 0.16%).
| Demographics | Rating | Rank | Doctorate Degree |
| Belgians | 50.3 /100 | #172 | Average 1.8% |
| Norwegians | 50.0 /100 | #173 | Average 1.8% |
| Immigrants | Bangladesh | 50.0 /100 | #174 | Average 1.8% |
| Immigrants | Thailand | 49.4 /100 | #175 | Average 1.8% |
| Spanish | 49.3 /100 | #176 | Average 1.8% |
| Iraqis | 49.2 /100 | #177 | Average 1.8% |
| French | 48.8 /100 | #178 | Average 1.8% |
| Ghanaians | 48.3 /100 | #179 | Average 1.8% |
| Scandinavians | 48.0 /100 | #180 | Average 1.8% |
| Immigrants | Immigrants | 46.2 /100 | #181 | Average 1.8% |
| Immigrants | Afghanistan | 44.3 /100 | #182 | Average 1.8% |
| Finns | 42.1 /100 | #183 | Average 1.8% |
| Nigerians | 39.9 /100 | #184 | Fair 1.8% |
| Slovaks | 36.4 /100 | #185 | Fair 1.8% |
| Peruvians | 34.4 /100 | #186 | Fair 1.8% |
Demographics Similar to Immigrants from Sudan by Doctorate Degree
In terms of doctorate degree, the demographic groups most similar to Immigrants from Sudan are Chilean (2.2%, a difference of 0.26%), Immigrants from Scotland (2.2%, a difference of 0.47%), Alsatian (2.1%, a difference of 0.48%), British (2.2%, a difference of 0.49%), and Immigrants from Nepal (2.2%, a difference of 0.93%).
| Demographics | Rating | Rank | Doctorate Degree |
| Immigrants | England | 99.6 /100 | #84 | Exceptional 2.2% |
| Immigrants | Brazil | 99.6 /100 | #85 | Exceptional 2.2% |
| Egyptians | 99.4 /100 | #86 | Exceptional 2.2% |
| Immigrants | Zimbabwe | 99.4 /100 | #87 | Exceptional 2.2% |
| Immigrants | Nepal | 99.3 /100 | #88 | Exceptional 2.2% |
| British | 99.3 /100 | #89 | Exceptional 2.2% |
| Immigrants | Scotland | 99.2 /100 | #90 | Exceptional 2.2% |
| Immigrants | Sudan | 99.1 /100 | #91 | Exceptional 2.2% |
| Chileans | 99.1 /100 | #92 | Exceptional 2.2% |
| Alsatians | 99.0 /100 | #93 | Exceptional 2.1% |
| Greeks | 98.8 /100 | #94 | Exceptional 2.1% |
| Immigrants | Romania | 98.7 /100 | #95 | Exceptional 2.1% |
| Immigrants | Northern Africa | 98.4 /100 | #96 | Exceptional 2.1% |
| Immigrants | Eritrea | 98.4 /100 | #97 | Exceptional 2.1% |
| Armenians | 98.3 /100 | #98 | Exceptional 2.1% |