Nepalese vs Immigrants from Latvia Doctorate Degree
COMPARE
Nepalese
Immigrants from Latvia
Doctorate Degree
Doctorate Degree Comparison
Nepalese
Immigrants from Latvia
1.3%
DOCTORATE DEGREE
0.0/ 100
METRIC RATING
336th/ 347
METRIC RANK
2.4%
DOCTORATE DEGREE
100.0/ 100
METRIC RATING
53rd/ 347
METRIC RANK
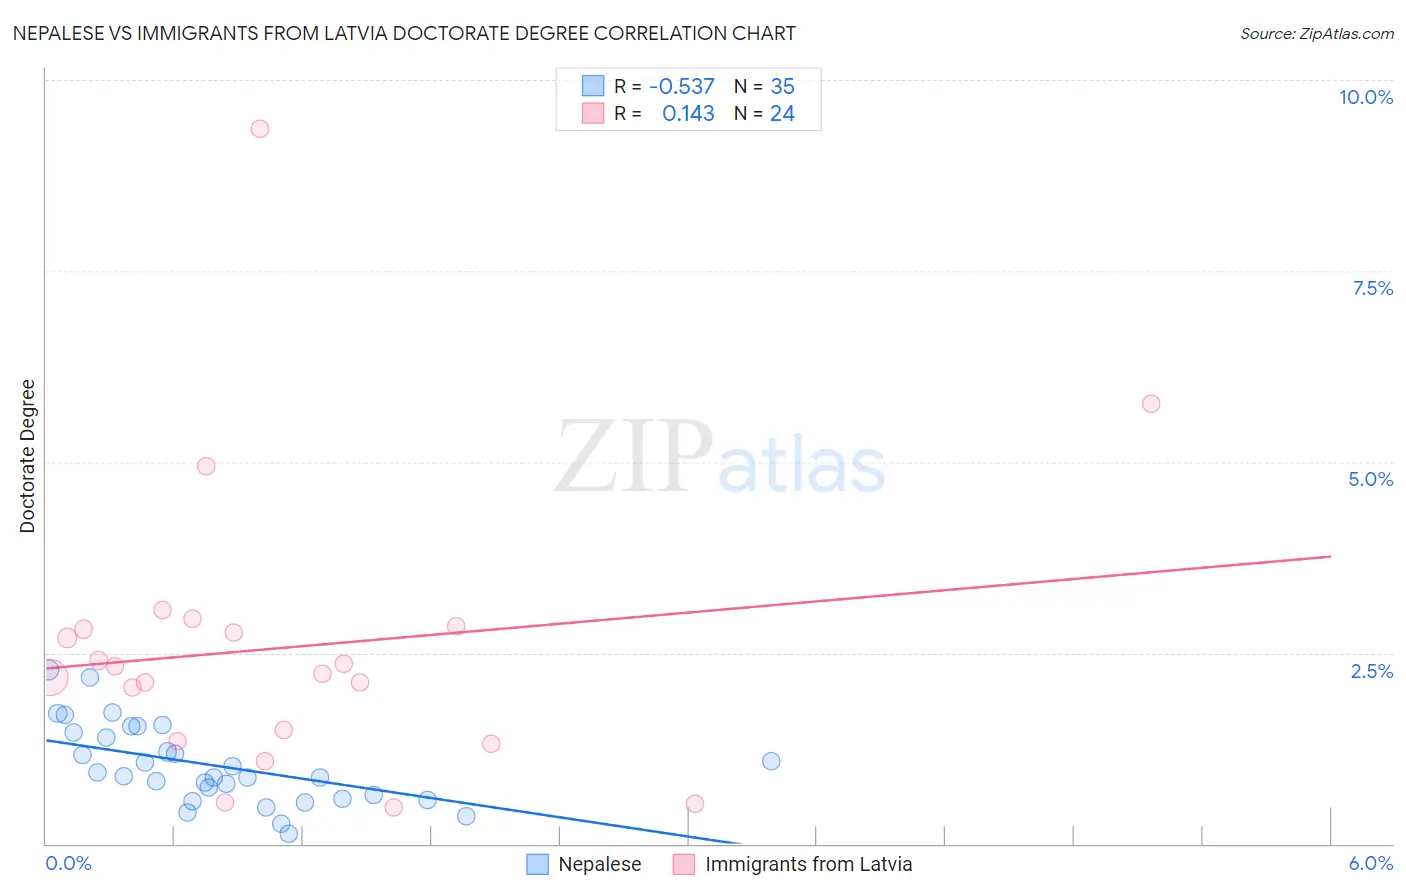
Nepalese vs Immigrants from Latvia Doctorate Degree Correlation Chart
The statistical analysis conducted on geographies consisting of 24,454,605 people shows a substantial negative correlation between the proportion of Nepalese and percentage of population with at least doctorate degree education in the United States with a correlation coefficient (R) of -0.537 and weighted average of 1.3%. Similarly, the statistical analysis conducted on geographies consisting of 113,595,553 people shows a poor positive correlation between the proportion of Immigrants from Latvia and percentage of population with at least doctorate degree education in the United States with a correlation coefficient (R) of 0.143 and weighted average of 2.4%, a difference of 90.1%.
Doctorate Degree Correlation Summary
| Measurement | Nepalese | Immigrants from Latvia |
| Minimum | 0.13% | 0.48% |
| Maximum | 2.3% | 9.4% |
| Range | 2.1% | 8.9% |
| Mean | 1.0% | 2.6% |
| Median | 0.89% | 2.3% |
| Interquartile 25% (IQ1) | 0.59% | 1.4% |
| Interquartile 75% (IQ3) | 1.5% | 2.8% |
| Interquartile Range (IQR) | 0.87% | 1.4% |
| Standard Deviation (Sample) | 0.52% | 1.9% |
| Standard Deviation (Population) | 0.51% | 1.9% |
Similar Demographics by Doctorate Degree
Demographics Similar to Nepalese by Doctorate Degree
In terms of doctorate degree, the demographic groups most similar to Nepalese are Immigrants from Haiti (1.3%, a difference of 0.23%), Immigrants from Dominican Republic (1.3%, a difference of 2.0%), Immigrants from Caribbean (1.3%, a difference of 2.2%), Yakama (1.3%, a difference of 2.4%), and Bangladeshi (1.2%, a difference of 3.5%).
| Demographics | Rating | Rank | Doctorate Degree |
| Haitians | 0.0 /100 | #329 | Tragic 1.3% |
| Yup'ik | 0.0 /100 | #330 | Tragic 1.3% |
| Immigrants | Latin America | 0.0 /100 | #331 | Tragic 1.3% |
| Yakama | 0.0 /100 | #332 | Tragic 1.3% |
| Immigrants | Caribbean | 0.0 /100 | #333 | Tragic 1.3% |
| Immigrants | Dominican Republic | 0.0 /100 | #334 | Tragic 1.3% |
| Immigrants | Haiti | 0.0 /100 | #335 | Tragic 1.3% |
| Nepalese | 0.0 /100 | #336 | Tragic 1.3% |
| Bangladeshis | 0.0 /100 | #337 | Tragic 1.2% |
| Puget Sound Salish | 0.0 /100 | #338 | Tragic 1.2% |
| Immigrants | Central America | 0.0 /100 | #339 | Tragic 1.2% |
| Immigrants | Cuba | 0.0 /100 | #340 | Tragic 1.2% |
| Mexicans | 0.0 /100 | #341 | Tragic 1.2% |
| Arapaho | 0.0 /100 | #342 | Tragic 1.2% |
| Fijians | 0.0 /100 | #343 | Tragic 1.1% |
Demographics Similar to Immigrants from Latvia by Doctorate Degree
In terms of doctorate degree, the demographic groups most similar to Immigrants from Latvia are Bulgarian (2.4%, a difference of 0.12%), Australian (2.4%, a difference of 0.59%), Immigrants from Norway (2.4%, a difference of 0.68%), Immigrants from Indonesia (2.4%, a difference of 0.68%), and Bolivian (2.4%, a difference of 0.76%).
| Demographics | Rating | Rank | Doctorate Degree |
| Immigrants | Austria | 100.0 /100 | #46 | Exceptional 2.4% |
| Immigrants | Western Europe | 100.0 /100 | #47 | Exceptional 2.4% |
| Asians | 100.0 /100 | #48 | Exceptional 2.4% |
| Immigrants | Asia | 100.0 /100 | #49 | Exceptional 2.4% |
| Immigrants | Norway | 100.0 /100 | #50 | Exceptional 2.4% |
| Australians | 100.0 /100 | #51 | Exceptional 2.4% |
| Bulgarians | 100.0 /100 | #52 | Exceptional 2.4% |
| Immigrants | Latvia | 100.0 /100 | #53 | Exceptional 2.4% |
| Immigrants | Indonesia | 100.0 /100 | #54 | Exceptional 2.4% |
| Bolivians | 100.0 /100 | #55 | Exceptional 2.4% |
| Immigrants | Czechoslovakia | 100.0 /100 | #56 | Exceptional 2.4% |
| Immigrants | Ethiopia | 100.0 /100 | #57 | Exceptional 2.4% |
| Ethiopians | 99.9 /100 | #58 | Exceptional 2.3% |
| South Africans | 99.9 /100 | #59 | Exceptional 2.3% |
| Immigrants | Serbia | 99.9 /100 | #60 | Exceptional 2.3% |