Chippewa vs Immigrants from Sudan Doctorate Degree
COMPARE
Chippewa
Immigrants from Sudan
Doctorate Degree
Doctorate Degree Comparison
Chippewa
Immigrants from Sudan
1.5%
DOCTORATE DEGREE
0.9/ 100
METRIC RATING
257th/ 347
METRIC RANK
2.2%
DOCTORATE DEGREE
99.1/ 100
METRIC RATING
91st/ 347
METRIC RANK
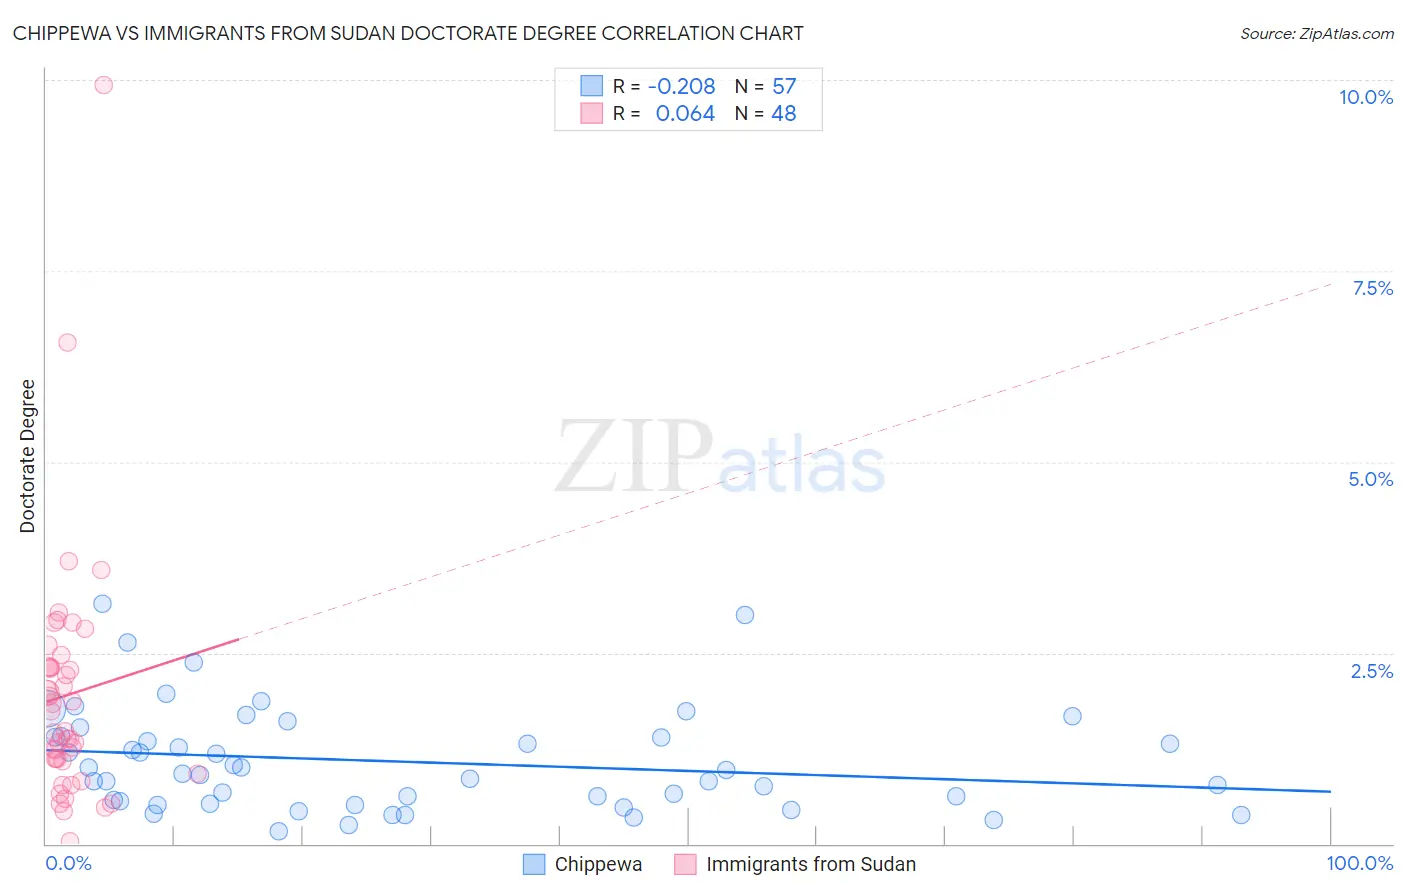
Chippewa vs Immigrants from Sudan Doctorate Degree Correlation Chart
The statistical analysis conducted on geographies consisting of 212,158,664 people shows a weak negative correlation between the proportion of Chippewa and percentage of population with at least doctorate degree education in the United States with a correlation coefficient (R) of -0.208 and weighted average of 1.5%. Similarly, the statistical analysis conducted on geographies consisting of 118,716,469 people shows a slight positive correlation between the proportion of Immigrants from Sudan and percentage of population with at least doctorate degree education in the United States with a correlation coefficient (R) of 0.064 and weighted average of 2.2%, a difference of 41.5%.
Doctorate Degree Correlation Summary
| Measurement | Chippewa | Immigrants from Sudan |
| Minimum | 0.17% | 0.039% |
| Maximum | 3.1% | 9.9% |
| Range | 3.0% | 9.9% |
| Mean | 1.1% | 1.9% |
| Median | 0.91% | 1.6% |
| Interquartile 25% (IQ1) | 0.54% | 1.1% |
| Interquartile 75% (IQ3) | 1.4% | 2.3% |
| Interquartile Range (IQR) | 0.86% | 1.2% |
| Standard Deviation (Sample) | 0.67% | 1.6% |
| Standard Deviation (Population) | 0.67% | 1.6% |
Similar Demographics by Doctorate Degree
Demographics Similar to Chippewa by Doctorate Degree
In terms of doctorate degree, the demographic groups most similar to Chippewa are Central American Indian (1.5%, a difference of 0.22%), Immigrants from West Indies (1.5%, a difference of 0.26%), Immigrants from Cambodia (1.5%, a difference of 0.27%), Trinidadian and Tobagonian (1.5%, a difference of 0.27%), and Liberian (1.5%, a difference of 0.28%).
| Demographics | Rating | Rank | Doctorate Degree |
| Immigrants | Fiji | 1.6 /100 | #250 | Tragic 1.6% |
| Apache | 1.3 /100 | #251 | Tragic 1.5% |
| Yuman | 1.1 /100 | #252 | Tragic 1.5% |
| Americans | 1.0 /100 | #253 | Tragic 1.5% |
| Immigrants | Cambodia | 1.0 /100 | #254 | Tragic 1.5% |
| Trinidadians and Tobagonians | 1.0 /100 | #255 | Tragic 1.5% |
| Central American Indians | 1.0 /100 | #256 | Tragic 1.5% |
| Chippewa | 0.9 /100 | #257 | Tragic 1.5% |
| Immigrants | West Indies | 0.9 /100 | #258 | Tragic 1.5% |
| Liberians | 0.9 /100 | #259 | Tragic 1.5% |
| Japanese | 0.9 /100 | #260 | Tragic 1.5% |
| Immigrants | Portugal | 0.8 /100 | #261 | Tragic 1.5% |
| Chickasaw | 0.7 /100 | #262 | Tragic 1.5% |
| Immigrants | Bahamas | 0.7 /100 | #263 | Tragic 1.5% |
| Blackfeet | 0.7 /100 | #264 | Tragic 1.5% |
Demographics Similar to Immigrants from Sudan by Doctorate Degree
In terms of doctorate degree, the demographic groups most similar to Immigrants from Sudan are Chilean (2.2%, a difference of 0.26%), Immigrants from Scotland (2.2%, a difference of 0.47%), Alsatian (2.1%, a difference of 0.48%), British (2.2%, a difference of 0.49%), and Immigrants from Nepal (2.2%, a difference of 0.93%).
| Demographics | Rating | Rank | Doctorate Degree |
| Immigrants | England | 99.6 /100 | #84 | Exceptional 2.2% |
| Immigrants | Brazil | 99.6 /100 | #85 | Exceptional 2.2% |
| Egyptians | 99.4 /100 | #86 | Exceptional 2.2% |
| Immigrants | Zimbabwe | 99.4 /100 | #87 | Exceptional 2.2% |
| Immigrants | Nepal | 99.3 /100 | #88 | Exceptional 2.2% |
| British | 99.3 /100 | #89 | Exceptional 2.2% |
| Immigrants | Scotland | 99.2 /100 | #90 | Exceptional 2.2% |
| Immigrants | Sudan | 99.1 /100 | #91 | Exceptional 2.2% |
| Chileans | 99.1 /100 | #92 | Exceptional 2.2% |
| Alsatians | 99.0 /100 | #93 | Exceptional 2.1% |
| Greeks | 98.8 /100 | #94 | Exceptional 2.1% |
| Immigrants | Romania | 98.7 /100 | #95 | Exceptional 2.1% |
| Immigrants | Northern Africa | 98.4 /100 | #96 | Exceptional 2.1% |
| Immigrants | Eritrea | 98.4 /100 | #97 | Exceptional 2.1% |
| Armenians | 98.3 /100 | #98 | Exceptional 2.1% |