Nepalese vs Immigrants from Sri Lanka Doctorate Degree
COMPARE
Nepalese
Immigrants from Sri Lanka
Doctorate Degree
Doctorate Degree Comparison
Nepalese
Immigrants from Sri Lanka
1.3%
DOCTORATE DEGREE
0.0/ 100
METRIC RATING
336th/ 347
METRIC RANK
2.8%
DOCTORATE DEGREE
100.0/ 100
METRIC RATING
18th/ 347
METRIC RANK
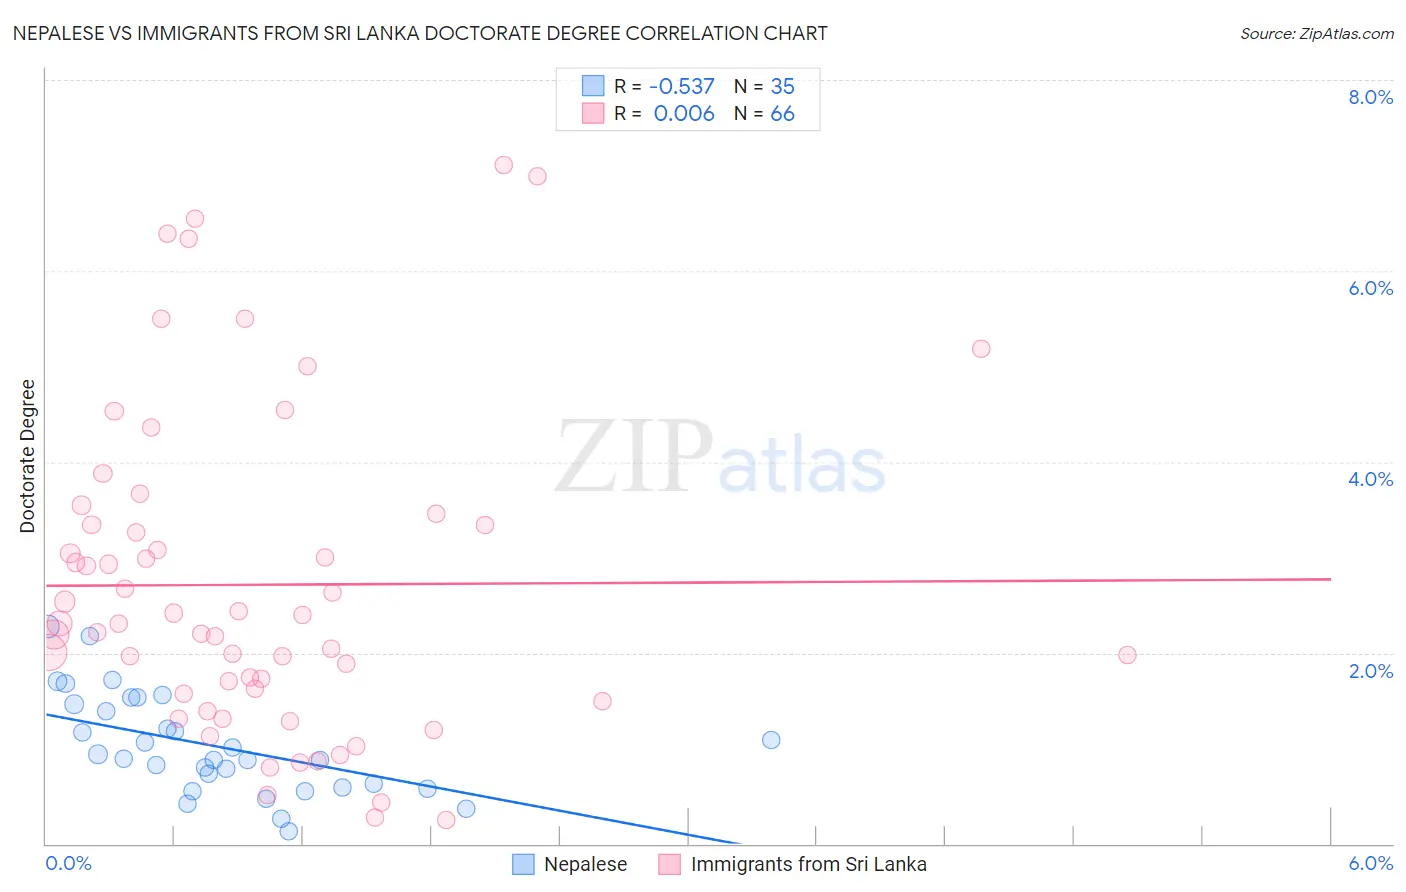
Nepalese vs Immigrants from Sri Lanka Doctorate Degree Correlation Chart
The statistical analysis conducted on geographies consisting of 24,454,605 people shows a substantial negative correlation between the proportion of Nepalese and percentage of population with at least doctorate degree education in the United States with a correlation coefficient (R) of -0.537 and weighted average of 1.3%. Similarly, the statistical analysis conducted on geographies consisting of 149,516,324 people shows no correlation between the proportion of Immigrants from Sri Lanka and percentage of population with at least doctorate degree education in the United States with a correlation coefficient (R) of 0.006 and weighted average of 2.8%, a difference of 122.9%.
Doctorate Degree Correlation Summary
| Measurement | Nepalese | Immigrants from Sri Lanka |
| Minimum | 0.13% | 0.25% |
| Maximum | 2.3% | 7.1% |
| Range | 2.1% | 6.9% |
| Mean | 1.0% | 2.7% |
| Median | 0.89% | 2.3% |
| Interquartile 25% (IQ1) | 0.59% | 1.6% |
| Interquartile 75% (IQ3) | 1.5% | 3.3% |
| Interquartile Range (IQR) | 0.87% | 1.8% |
| Standard Deviation (Sample) | 0.52% | 1.7% |
| Standard Deviation (Population) | 0.51% | 1.7% |
Similar Demographics by Doctorate Degree
Demographics Similar to Nepalese by Doctorate Degree
In terms of doctorate degree, the demographic groups most similar to Nepalese are Immigrants from Haiti (1.3%, a difference of 0.23%), Immigrants from Dominican Republic (1.3%, a difference of 2.0%), Immigrants from Caribbean (1.3%, a difference of 2.2%), Yakama (1.3%, a difference of 2.4%), and Bangladeshi (1.2%, a difference of 3.5%).
| Demographics | Rating | Rank | Doctorate Degree |
| Haitians | 0.0 /100 | #329 | Tragic 1.3% |
| Yup'ik | 0.0 /100 | #330 | Tragic 1.3% |
| Immigrants | Latin America | 0.0 /100 | #331 | Tragic 1.3% |
| Yakama | 0.0 /100 | #332 | Tragic 1.3% |
| Immigrants | Caribbean | 0.0 /100 | #333 | Tragic 1.3% |
| Immigrants | Dominican Republic | 0.0 /100 | #334 | Tragic 1.3% |
| Immigrants | Haiti | 0.0 /100 | #335 | Tragic 1.3% |
| Nepalese | 0.0 /100 | #336 | Tragic 1.3% |
| Bangladeshis | 0.0 /100 | #337 | Tragic 1.2% |
| Puget Sound Salish | 0.0 /100 | #338 | Tragic 1.2% |
| Immigrants | Central America | 0.0 /100 | #339 | Tragic 1.2% |
| Immigrants | Cuba | 0.0 /100 | #340 | Tragic 1.2% |
| Mexicans | 0.0 /100 | #341 | Tragic 1.2% |
| Arapaho | 0.0 /100 | #342 | Tragic 1.2% |
| Fijians | 0.0 /100 | #343 | Tragic 1.1% |
Demographics Similar to Immigrants from Sri Lanka by Doctorate Degree
In terms of doctorate degree, the demographic groups most similar to Immigrants from Sri Lanka are Immigrants from Australia (2.8%, a difference of 0.24%), Immigrants from Japan (2.8%, a difference of 0.37%), Immigrants from Hong Kong (2.8%, a difference of 0.73%), Eastern European (2.8%, a difference of 0.94%), and Thai (2.8%, a difference of 1.1%).
| Demographics | Rating | Rank | Doctorate Degree |
| Indians (Asian) | 100.0 /100 | #11 | Exceptional 2.9% |
| Immigrants | Belgium | 100.0 /100 | #12 | Exceptional 2.9% |
| Immigrants | Sweden | 100.0 /100 | #13 | Exceptional 2.9% |
| Immigrants | France | 100.0 /100 | #14 | Exceptional 2.9% |
| Immigrants | India | 100.0 /100 | #15 | Exceptional 2.8% |
| Eastern Europeans | 100.0 /100 | #16 | Exceptional 2.8% |
| Immigrants | Australia | 100.0 /100 | #17 | Exceptional 2.8% |
| Immigrants | Sri Lanka | 100.0 /100 | #18 | Exceptional 2.8% |
| Immigrants | Japan | 100.0 /100 | #19 | Exceptional 2.8% |
| Immigrants | Hong Kong | 100.0 /100 | #20 | Exceptional 2.8% |
| Thais | 100.0 /100 | #21 | Exceptional 2.8% |
| Mongolians | 100.0 /100 | #22 | Exceptional 2.8% |
| Immigrants | Denmark | 100.0 /100 | #23 | Exceptional 2.8% |
| Israelis | 100.0 /100 | #24 | Exceptional 2.7% |
| Immigrants | Saudi Arabia | 100.0 /100 | #25 | Exceptional 2.7% |