Nepalese vs Israeli Doctorate Degree
COMPARE
Nepalese
Israeli
Doctorate Degree
Doctorate Degree Comparison
Nepalese
Israelis
1.3%
DOCTORATE DEGREE
0.0/ 100
METRIC RATING
336th/ 347
METRIC RANK
2.7%
DOCTORATE DEGREE
100.0/ 100
METRIC RATING
24th/ 347
METRIC RANK
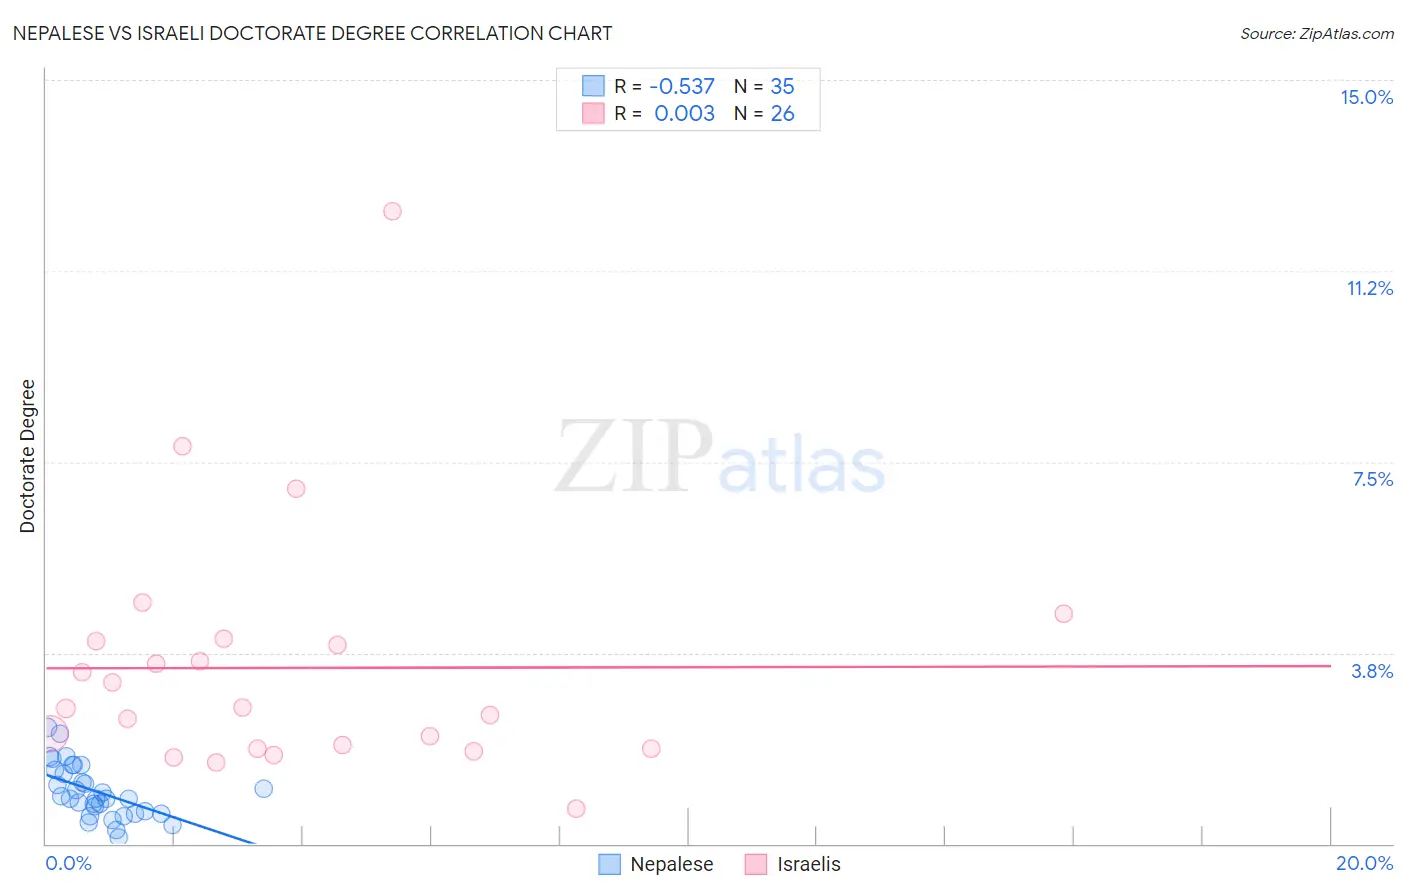
Nepalese vs Israeli Doctorate Degree Correlation Chart
The statistical analysis conducted on geographies consisting of 24,454,605 people shows a substantial negative correlation between the proportion of Nepalese and percentage of population with at least doctorate degree education in the United States with a correlation coefficient (R) of -0.537 and weighted average of 1.3%. Similarly, the statistical analysis conducted on geographies consisting of 210,422,088 people shows no correlation between the proportion of Israelis and percentage of population with at least doctorate degree education in the United States with a correlation coefficient (R) of 0.003 and weighted average of 2.7%, a difference of 117.0%.
Doctorate Degree Correlation Summary
| Measurement | Nepalese | Israeli |
| Minimum | 0.13% | 0.70% |
| Maximum | 2.3% | 12.4% |
| Range | 2.1% | 11.7% |
| Mean | 1.0% | 3.5% |
| Median | 0.89% | 2.7% |
| Interquartile 25% (IQ1) | 0.59% | 1.9% |
| Interquartile 75% (IQ3) | 1.5% | 4.0% |
| Interquartile Range (IQR) | 0.87% | 2.1% |
| Standard Deviation (Sample) | 0.52% | 2.4% |
| Standard Deviation (Population) | 0.51% | 2.4% |
Similar Demographics by Doctorate Degree
Demographics Similar to Nepalese by Doctorate Degree
In terms of doctorate degree, the demographic groups most similar to Nepalese are Immigrants from Haiti (1.3%, a difference of 0.23%), Immigrants from Dominican Republic (1.3%, a difference of 2.0%), Immigrants from Caribbean (1.3%, a difference of 2.2%), Yakama (1.3%, a difference of 2.4%), and Bangladeshi (1.2%, a difference of 3.5%).
| Demographics | Rating | Rank | Doctorate Degree |
| Haitians | 0.0 /100 | #329 | Tragic 1.3% |
| Yup'ik | 0.0 /100 | #330 | Tragic 1.3% |
| Immigrants | Latin America | 0.0 /100 | #331 | Tragic 1.3% |
| Yakama | 0.0 /100 | #332 | Tragic 1.3% |
| Immigrants | Caribbean | 0.0 /100 | #333 | Tragic 1.3% |
| Immigrants | Dominican Republic | 0.0 /100 | #334 | Tragic 1.3% |
| Immigrants | Haiti | 0.0 /100 | #335 | Tragic 1.3% |
| Nepalese | 0.0 /100 | #336 | Tragic 1.3% |
| Bangladeshis | 0.0 /100 | #337 | Tragic 1.2% |
| Puget Sound Salish | 0.0 /100 | #338 | Tragic 1.2% |
| Immigrants | Central America | 0.0 /100 | #339 | Tragic 1.2% |
| Immigrants | Cuba | 0.0 /100 | #340 | Tragic 1.2% |
| Mexicans | 0.0 /100 | #341 | Tragic 1.2% |
| Arapaho | 0.0 /100 | #342 | Tragic 1.2% |
| Fijians | 0.0 /100 | #343 | Tragic 1.1% |
Demographics Similar to Israelis by Doctorate Degree
In terms of doctorate degree, the demographic groups most similar to Israelis are Immigrants from Denmark (2.8%, a difference of 1.3%), Mongolian (2.8%, a difference of 1.4%), Immigrants from Saudi Arabia (2.7%, a difference of 1.5%), Thai (2.8%, a difference of 1.6%), and Immigrants from Hong Kong (2.8%, a difference of 2.0%).
| Demographics | Rating | Rank | Doctorate Degree |
| Immigrants | Australia | 100.0 /100 | #17 | Exceptional 2.8% |
| Immigrants | Sri Lanka | 100.0 /100 | #18 | Exceptional 2.8% |
| Immigrants | Japan | 100.0 /100 | #19 | Exceptional 2.8% |
| Immigrants | Hong Kong | 100.0 /100 | #20 | Exceptional 2.8% |
| Thais | 100.0 /100 | #21 | Exceptional 2.8% |
| Mongolians | 100.0 /100 | #22 | Exceptional 2.8% |
| Immigrants | Denmark | 100.0 /100 | #23 | Exceptional 2.8% |
| Israelis | 100.0 /100 | #24 | Exceptional 2.7% |
| Immigrants | Saudi Arabia | 100.0 /100 | #25 | Exceptional 2.7% |
| Turks | 100.0 /100 | #26 | Exceptional 2.7% |
| Immigrants | Turkey | 100.0 /100 | #27 | Exceptional 2.6% |
| Burmese | 100.0 /100 | #28 | Exceptional 2.6% |
| Immigrants | South Central Asia | 100.0 /100 | #29 | Exceptional 2.6% |
| Immigrants | Korea | 100.0 /100 | #30 | Exceptional 2.6% |
| Latvians | 100.0 /100 | #31 | Exceptional 2.6% |