Nepalese vs Immigrants from Guatemala Doctorate Degree
COMPARE
Nepalese
Immigrants from Guatemala
Doctorate Degree
Doctorate Degree Comparison
Nepalese
Immigrants from Guatemala
1.3%
DOCTORATE DEGREE
0.0/ 100
METRIC RATING
336th/ 347
METRIC RANK
1.4%
DOCTORATE DEGREE
0.1/ 100
METRIC RATING
300th/ 347
METRIC RANK
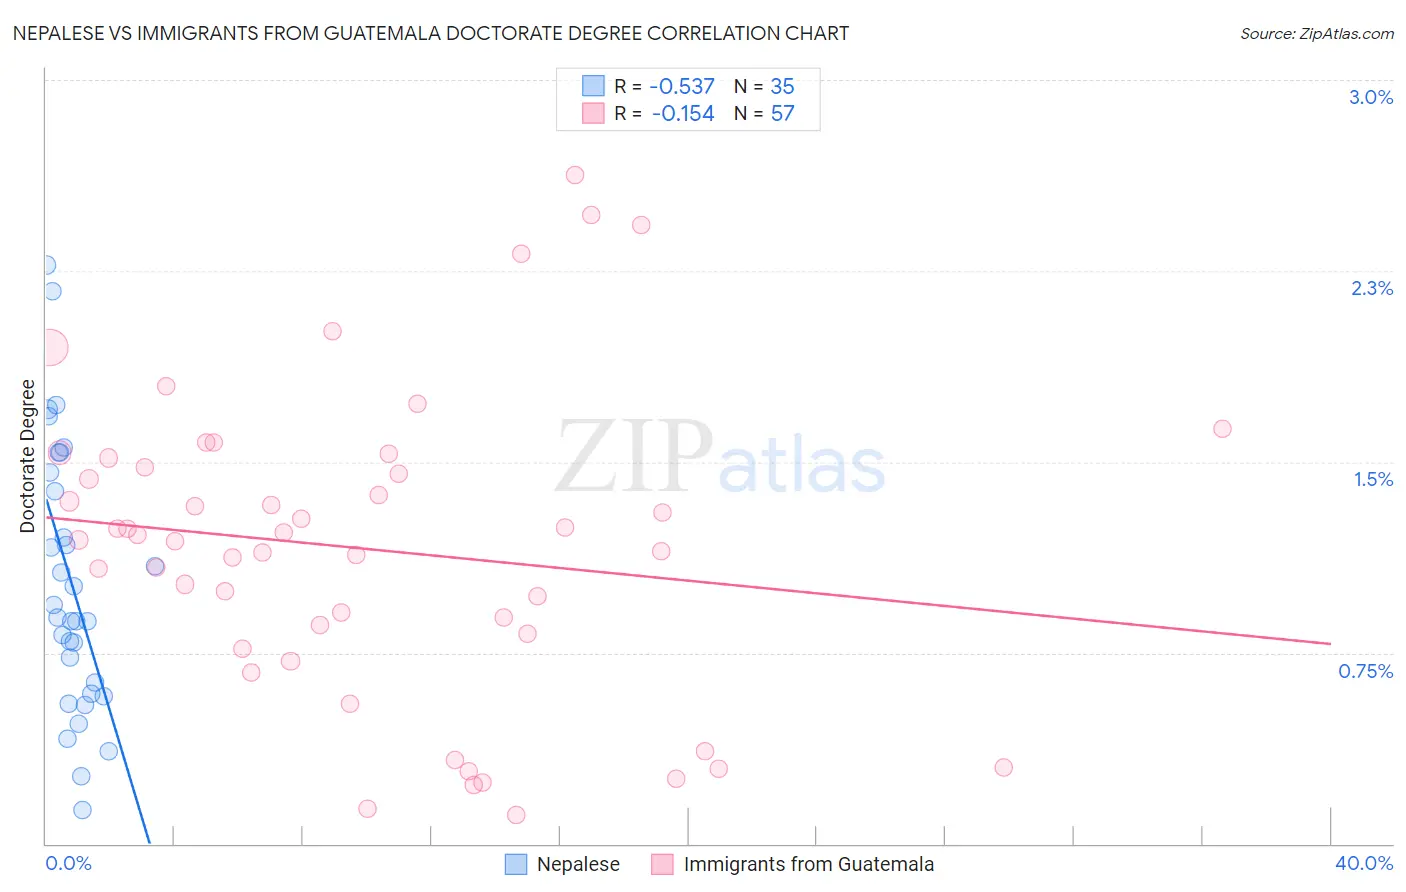
Nepalese vs Immigrants from Guatemala Doctorate Degree Correlation Chart
The statistical analysis conducted on geographies consisting of 24,454,605 people shows a substantial negative correlation between the proportion of Nepalese and percentage of population with at least doctorate degree education in the United States with a correlation coefficient (R) of -0.537 and weighted average of 1.3%. Similarly, the statistical analysis conducted on geographies consisting of 372,323,954 people shows a poor negative correlation between the proportion of Immigrants from Guatemala and percentage of population with at least doctorate degree education in the United States with a correlation coefficient (R) of -0.154 and weighted average of 1.4%, a difference of 10.8%.
Doctorate Degree Correlation Summary
| Measurement | Nepalese | Immigrants from Guatemala |
| Minimum | 0.13% | 0.11% |
| Maximum | 2.3% | 2.6% |
| Range | 2.1% | 2.5% |
| Mean | 1.0% | 1.2% |
| Median | 0.89% | 1.2% |
| Interquartile 25% (IQ1) | 0.59% | 0.80% |
| Interquartile 75% (IQ3) | 1.5% | 1.5% |
| Interquartile Range (IQR) | 0.87% | 0.70% |
| Standard Deviation (Sample) | 0.52% | 0.60% |
| Standard Deviation (Population) | 0.51% | 0.59% |
Similar Demographics by Doctorate Degree
Demographics Similar to Nepalese by Doctorate Degree
In terms of doctorate degree, the demographic groups most similar to Nepalese are Immigrants from Haiti (1.3%, a difference of 0.23%), Immigrants from Dominican Republic (1.3%, a difference of 2.0%), Immigrants from Caribbean (1.3%, a difference of 2.2%), Yakama (1.3%, a difference of 2.4%), and Bangladeshi (1.2%, a difference of 3.5%).
| Demographics | Rating | Rank | Doctorate Degree |
| Haitians | 0.0 /100 | #329 | Tragic 1.3% |
| Yup'ik | 0.0 /100 | #330 | Tragic 1.3% |
| Immigrants | Latin America | 0.0 /100 | #331 | Tragic 1.3% |
| Yakama | 0.0 /100 | #332 | Tragic 1.3% |
| Immigrants | Caribbean | 0.0 /100 | #333 | Tragic 1.3% |
| Immigrants | Dominican Republic | 0.0 /100 | #334 | Tragic 1.3% |
| Immigrants | Haiti | 0.0 /100 | #335 | Tragic 1.3% |
| Nepalese | 0.0 /100 | #336 | Tragic 1.3% |
| Bangladeshis | 0.0 /100 | #337 | Tragic 1.2% |
| Puget Sound Salish | 0.0 /100 | #338 | Tragic 1.2% |
| Immigrants | Central America | 0.0 /100 | #339 | Tragic 1.2% |
| Immigrants | Cuba | 0.0 /100 | #340 | Tragic 1.2% |
| Mexicans | 0.0 /100 | #341 | Tragic 1.2% |
| Arapaho | 0.0 /100 | #342 | Tragic 1.2% |
| Fijians | 0.0 /100 | #343 | Tragic 1.1% |
Demographics Similar to Immigrants from Guatemala by Doctorate Degree
In terms of doctorate degree, the demographic groups most similar to Immigrants from Guatemala are Honduran (1.4%, a difference of 0.070%), Belizean (1.4%, a difference of 0.33%), Shoshone (1.4%, a difference of 0.40%), Immigrants from Dominica (1.4%, a difference of 0.42%), and Mexican American Indian (1.4%, a difference of 0.48%).
| Demographics | Rating | Rank | Doctorate Degree |
| Immigrants | Yemen | 0.2 /100 | #293 | Tragic 1.4% |
| Samoans | 0.2 /100 | #294 | Tragic 1.4% |
| Guatemalans | 0.2 /100 | #295 | Tragic 1.4% |
| Immigrants | Ecuador | 0.2 /100 | #296 | Tragic 1.4% |
| Tsimshian | 0.2 /100 | #297 | Tragic 1.4% |
| Puerto Ricans | 0.1 /100 | #298 | Tragic 1.4% |
| Belizeans | 0.1 /100 | #299 | Tragic 1.4% |
| Immigrants | Guatemala | 0.1 /100 | #300 | Tragic 1.4% |
| Hondurans | 0.1 /100 | #301 | Tragic 1.4% |
| Shoshone | 0.1 /100 | #302 | Tragic 1.4% |
| Immigrants | Dominica | 0.1 /100 | #303 | Tragic 1.4% |
| Mexican American Indians | 0.1 /100 | #304 | Tragic 1.4% |
| Pennsylvania Germans | 0.1 /100 | #305 | Tragic 1.4% |
| Guyanese | 0.1 /100 | #306 | Tragic 1.4% |
| Cubans | 0.1 /100 | #307 | Tragic 1.4% |