Polish vs Dutch West Indian Doctorate Degree
COMPARE
Polish
Dutch West Indian
Doctorate Degree
Doctorate Degree Comparison
Poles
Dutch West Indians
1.9%
DOCTORATE DEGREE
72.7/ 100
METRIC RATING
155th/ 347
METRIC RANK
1.3%
DOCTORATE DEGREE
0.1/ 100
METRIC RATING
321st/ 347
METRIC RANK
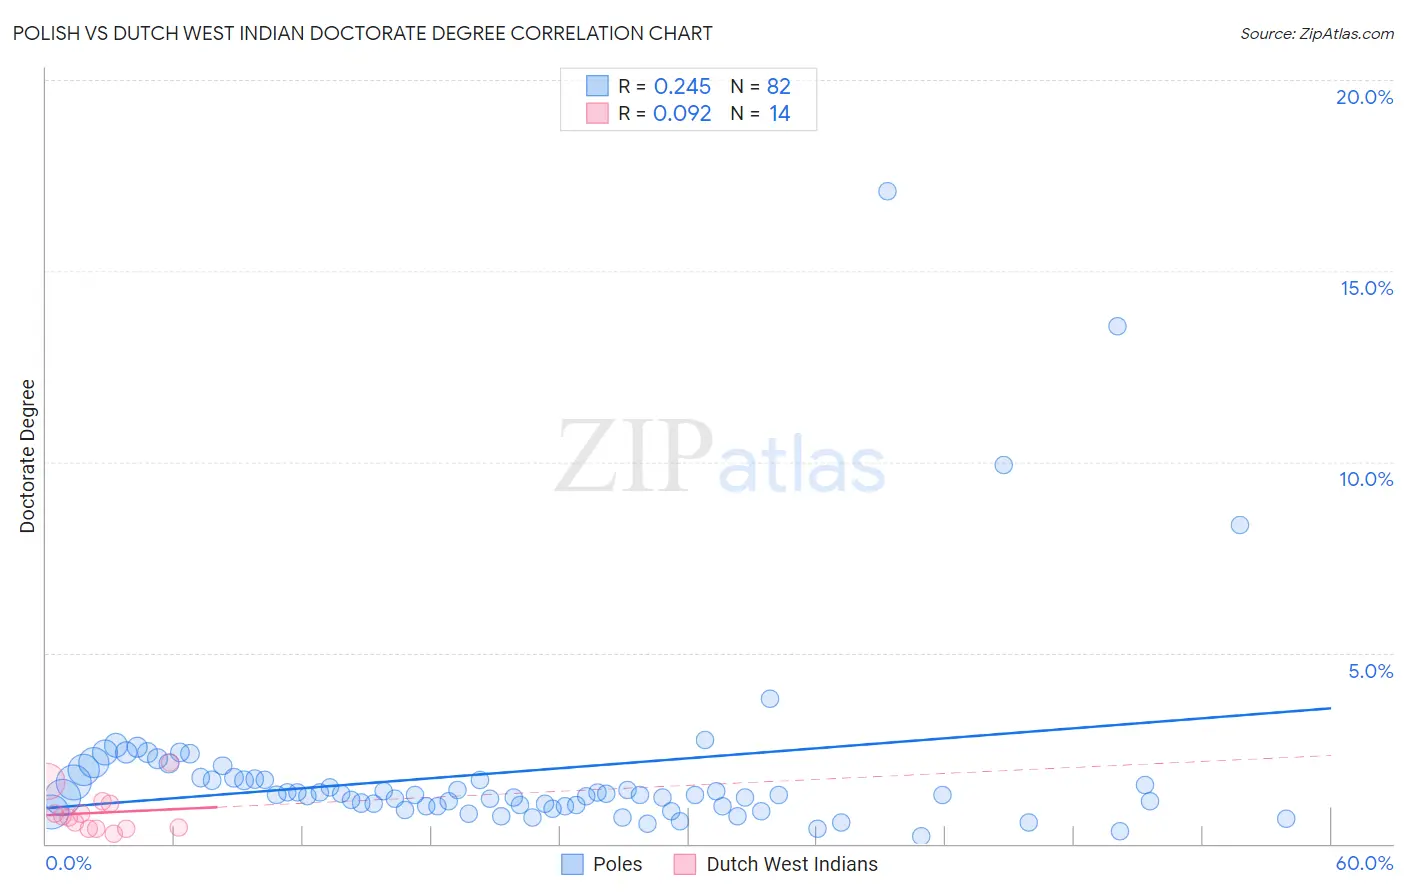
Polish vs Dutch West Indian Doctorate Degree Correlation Chart
The statistical analysis conducted on geographies consisting of 539,143,774 people shows a weak positive correlation between the proportion of Poles and percentage of population with at least doctorate degree education in the United States with a correlation coefficient (R) of 0.245 and weighted average of 1.9%. Similarly, the statistical analysis conducted on geographies consisting of 84,429,780 people shows a slight positive correlation between the proportion of Dutch West Indians and percentage of population with at least doctorate degree education in the United States with a correlation coefficient (R) of 0.092 and weighted average of 1.3%, a difference of 43.0%.
Doctorate Degree Correlation Summary
| Measurement | Polish | Dutch West Indian |
| Minimum | 0.20% | 0.26% |
| Maximum | 17.1% | 2.1% |
| Range | 16.9% | 1.9% |
| Mean | 1.9% | 0.81% |
| Median | 1.3% | 0.70% |
| Interquartile 25% (IQ1) | 0.98% | 0.41% |
| Interquartile 75% (IQ3) | 1.7% | 1.1% |
| Interquartile Range (IQR) | 0.71% | 0.65% |
| Standard Deviation (Sample) | 2.5% | 0.53% |
| Standard Deviation (Population) | 2.5% | 0.51% |
Similar Demographics by Doctorate Degree
Demographics Similar to Poles by Doctorate Degree
In terms of doctorate degree, the demographic groups most similar to Poles are Immigrants from Albania (1.9%, a difference of 0.020%), Slavic (1.9%, a difference of 0.060%), Danish (1.9%, a difference of 0.14%), Hungarian (1.9%, a difference of 0.17%), and Immigrants from Oceania (1.9%, a difference of 0.24%).
| Demographics | Rating | Rank | Doctorate Degree |
| Luxembourgers | 81.1 /100 | #148 | Excellent 1.9% |
| Basques | 76.9 /100 | #149 | Good 1.9% |
| English | 75.9 /100 | #150 | Good 1.9% |
| Albanians | 74.8 /100 | #151 | Good 1.9% |
| Immigrants | Kenya | 74.3 /100 | #152 | Good 1.9% |
| Immigrants | Oceania | 74.0 /100 | #153 | Good 1.9% |
| Immigrants | Albania | 72.8 /100 | #154 | Good 1.9% |
| Poles | 72.7 /100 | #155 | Good 1.9% |
| Slavs | 72.4 /100 | #156 | Good 1.9% |
| Danes | 71.9 /100 | #157 | Good 1.9% |
| Hungarians | 71.7 /100 | #158 | Good 1.9% |
| Slovenes | 70.2 /100 | #159 | Good 1.9% |
| Welsh | 69.7 /100 | #160 | Good 1.9% |
| Immigrants | Middle Africa | 68.8 /100 | #161 | Good 1.9% |
| Irish | 67.5 /100 | #162 | Good 1.9% |
Demographics Similar to Dutch West Indians by Doctorate Degree
In terms of doctorate degree, the demographic groups most similar to Dutch West Indians are Seminole (1.3%, a difference of 0.060%), Immigrants from St. Vincent and the Grenadines (1.3%, a difference of 0.11%), Immigrants from Guyana (1.3%, a difference of 0.17%), Immigrants from Belize (1.3%, a difference of 0.26%), and Native/Alaskan (1.3%, a difference of 0.58%).
| Demographics | Rating | Rank | Doctorate Degree |
| Dominicans | 0.1 /100 | #314 | Tragic 1.4% |
| Immigrants | Azores | 0.1 /100 | #315 | Tragic 1.4% |
| Navajo | 0.1 /100 | #316 | Tragic 1.4% |
| Immigrants | Micronesia | 0.1 /100 | #317 | Tragic 1.3% |
| Creek | 0.1 /100 | #318 | Tragic 1.3% |
| Immigrants | Guyana | 0.1 /100 | #319 | Tragic 1.3% |
| Immigrants | St. Vincent and the Grenadines | 0.1 /100 | #320 | Tragic 1.3% |
| Dutch West Indians | 0.1 /100 | #321 | Tragic 1.3% |
| Seminole | 0.1 /100 | #322 | Tragic 1.3% |
| Immigrants | Belize | 0.1 /100 | #323 | Tragic 1.3% |
| Natives/Alaskans | 0.0 /100 | #324 | Tragic 1.3% |
| Pima | 0.0 /100 | #325 | Tragic 1.3% |
| Immigrants | Cabo Verde | 0.0 /100 | #326 | Tragic 1.3% |
| Hispanics or Latinos | 0.0 /100 | #327 | Tragic 1.3% |
| Inupiat | 0.0 /100 | #328 | Tragic 1.3% |