Apache vs Dutch West Indian Doctorate Degree
COMPARE
Apache
Dutch West Indian
Doctorate Degree
Doctorate Degree Comparison
Apache
Dutch West Indians
1.5%
DOCTORATE DEGREE
1.3/ 100
METRIC RATING
251st/ 347
METRIC RANK
1.3%
DOCTORATE DEGREE
0.1/ 100
METRIC RATING
321st/ 347
METRIC RANK
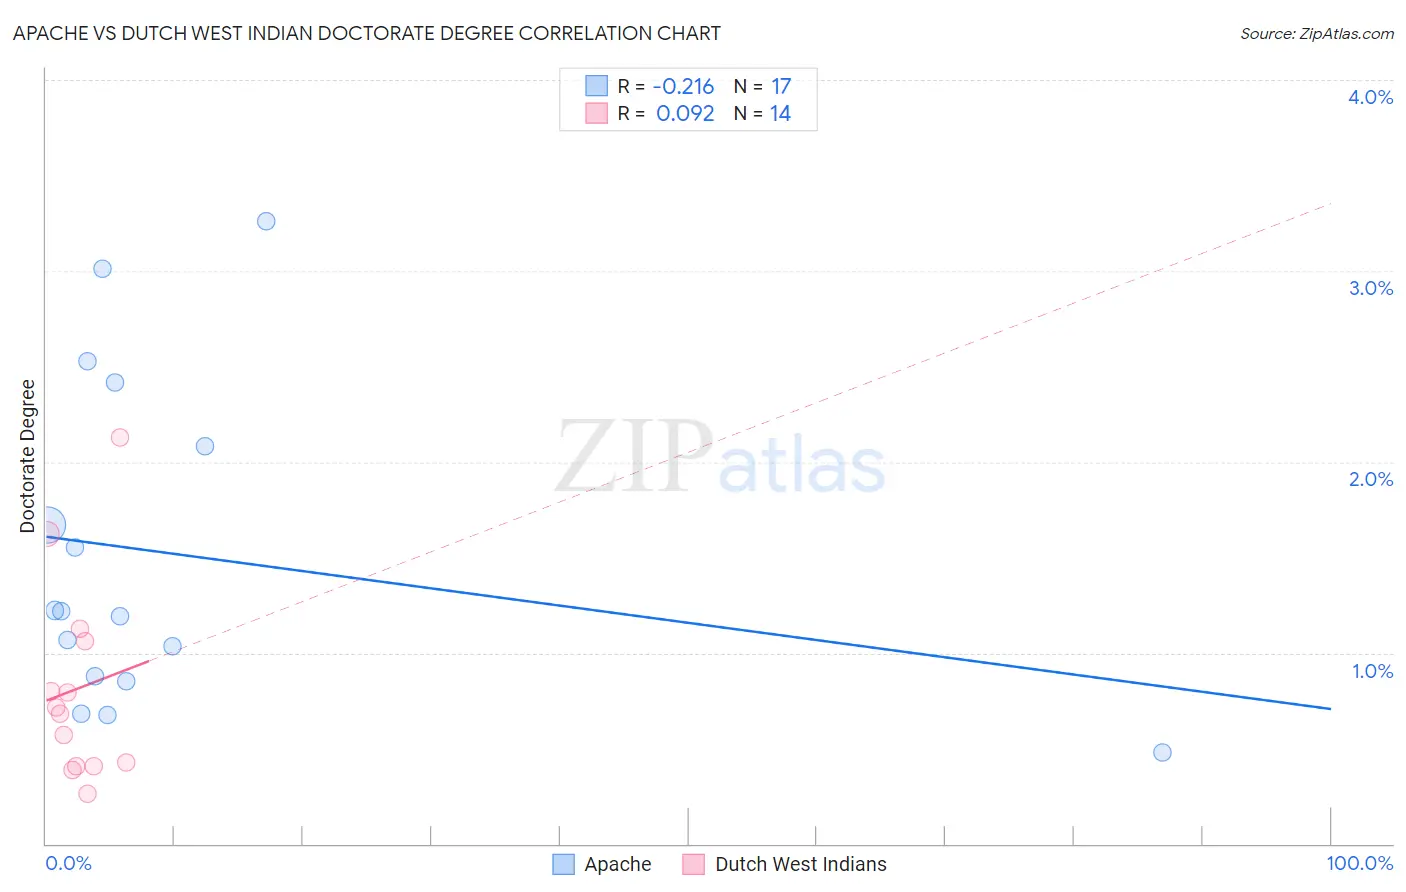
Apache vs Dutch West Indian Doctorate Degree Correlation Chart
The statistical analysis conducted on geographies consisting of 228,067,045 people shows a weak negative correlation between the proportion of Apache and percentage of population with at least doctorate degree education in the United States with a correlation coefficient (R) of -0.216 and weighted average of 1.5%. Similarly, the statistical analysis conducted on geographies consisting of 84,429,780 people shows a slight positive correlation between the proportion of Dutch West Indians and percentage of population with at least doctorate degree education in the United States with a correlation coefficient (R) of 0.092 and weighted average of 1.3%, a difference of 16.2%.
Doctorate Degree Correlation Summary
| Measurement | Apache | Dutch West Indian |
| Minimum | 0.48% | 0.26% |
| Maximum | 3.3% | 2.1% |
| Range | 2.8% | 1.9% |
| Mean | 1.5% | 0.81% |
| Median | 1.2% | 0.70% |
| Interquartile 25% (IQ1) | 0.86% | 0.41% |
| Interquartile 75% (IQ3) | 2.3% | 1.1% |
| Interquartile Range (IQR) | 1.4% | 0.65% |
| Standard Deviation (Sample) | 0.85% | 0.53% |
| Standard Deviation (Population) | 0.82% | 0.51% |
Similar Demographics by Doctorate Degree
Demographics Similar to Apache by Doctorate Degree
In terms of doctorate degree, the demographic groups most similar to Apache are Immigrants from Fiji (1.6%, a difference of 0.87%), Potawatomi (1.6%, a difference of 0.90%), Yuman (1.5%, a difference of 0.92%), American (1.5%, a difference of 1.1%), and Immigrants from Cambodia (1.5%, a difference of 1.2%).
| Demographics | Rating | Rank | Doctorate Degree |
| French American Indians | 2.0 /100 | #244 | Tragic 1.6% |
| Delaware | 1.9 /100 | #245 | Tragic 1.6% |
| Hmong | 1.8 /100 | #246 | Tragic 1.6% |
| Comanche | 1.8 /100 | #247 | Tragic 1.6% |
| Africans | 1.8 /100 | #248 | Tragic 1.6% |
| Potawatomi | 1.6 /100 | #249 | Tragic 1.6% |
| Immigrants | Fiji | 1.6 /100 | #250 | Tragic 1.6% |
| Apache | 1.3 /100 | #251 | Tragic 1.5% |
| Yuman | 1.1 /100 | #252 | Tragic 1.5% |
| Americans | 1.0 /100 | #253 | Tragic 1.5% |
| Immigrants | Cambodia | 1.0 /100 | #254 | Tragic 1.5% |
| Trinidadians and Tobagonians | 1.0 /100 | #255 | Tragic 1.5% |
| Central American Indians | 1.0 /100 | #256 | Tragic 1.5% |
| Chippewa | 0.9 /100 | #257 | Tragic 1.5% |
| Immigrants | West Indies | 0.9 /100 | #258 | Tragic 1.5% |
Demographics Similar to Dutch West Indians by Doctorate Degree
In terms of doctorate degree, the demographic groups most similar to Dutch West Indians are Seminole (1.3%, a difference of 0.060%), Immigrants from St. Vincent and the Grenadines (1.3%, a difference of 0.11%), Immigrants from Guyana (1.3%, a difference of 0.17%), Immigrants from Belize (1.3%, a difference of 0.26%), and Native/Alaskan (1.3%, a difference of 0.58%).
| Demographics | Rating | Rank | Doctorate Degree |
| Dominicans | 0.1 /100 | #314 | Tragic 1.4% |
| Immigrants | Azores | 0.1 /100 | #315 | Tragic 1.4% |
| Navajo | 0.1 /100 | #316 | Tragic 1.4% |
| Immigrants | Micronesia | 0.1 /100 | #317 | Tragic 1.3% |
| Creek | 0.1 /100 | #318 | Tragic 1.3% |
| Immigrants | Guyana | 0.1 /100 | #319 | Tragic 1.3% |
| Immigrants | St. Vincent and the Grenadines | 0.1 /100 | #320 | Tragic 1.3% |
| Dutch West Indians | 0.1 /100 | #321 | Tragic 1.3% |
| Seminole | 0.1 /100 | #322 | Tragic 1.3% |
| Immigrants | Belize | 0.1 /100 | #323 | Tragic 1.3% |
| Natives/Alaskans | 0.0 /100 | #324 | Tragic 1.3% |
| Pima | 0.0 /100 | #325 | Tragic 1.3% |
| Immigrants | Cabo Verde | 0.0 /100 | #326 | Tragic 1.3% |
| Hispanics or Latinos | 0.0 /100 | #327 | Tragic 1.3% |
| Inupiat | 0.0 /100 | #328 | Tragic 1.3% |