Canadian vs Dutch West Indian Doctorate Degree
COMPARE
Canadian
Dutch West Indian
Doctorate Degree
Doctorate Degree Comparison
Canadians
Dutch West Indians
2.0%
DOCTORATE DEGREE
90.6/ 100
METRIC RATING
129th/ 347
METRIC RANK
1.3%
DOCTORATE DEGREE
0.1/ 100
METRIC RATING
321st/ 347
METRIC RANK
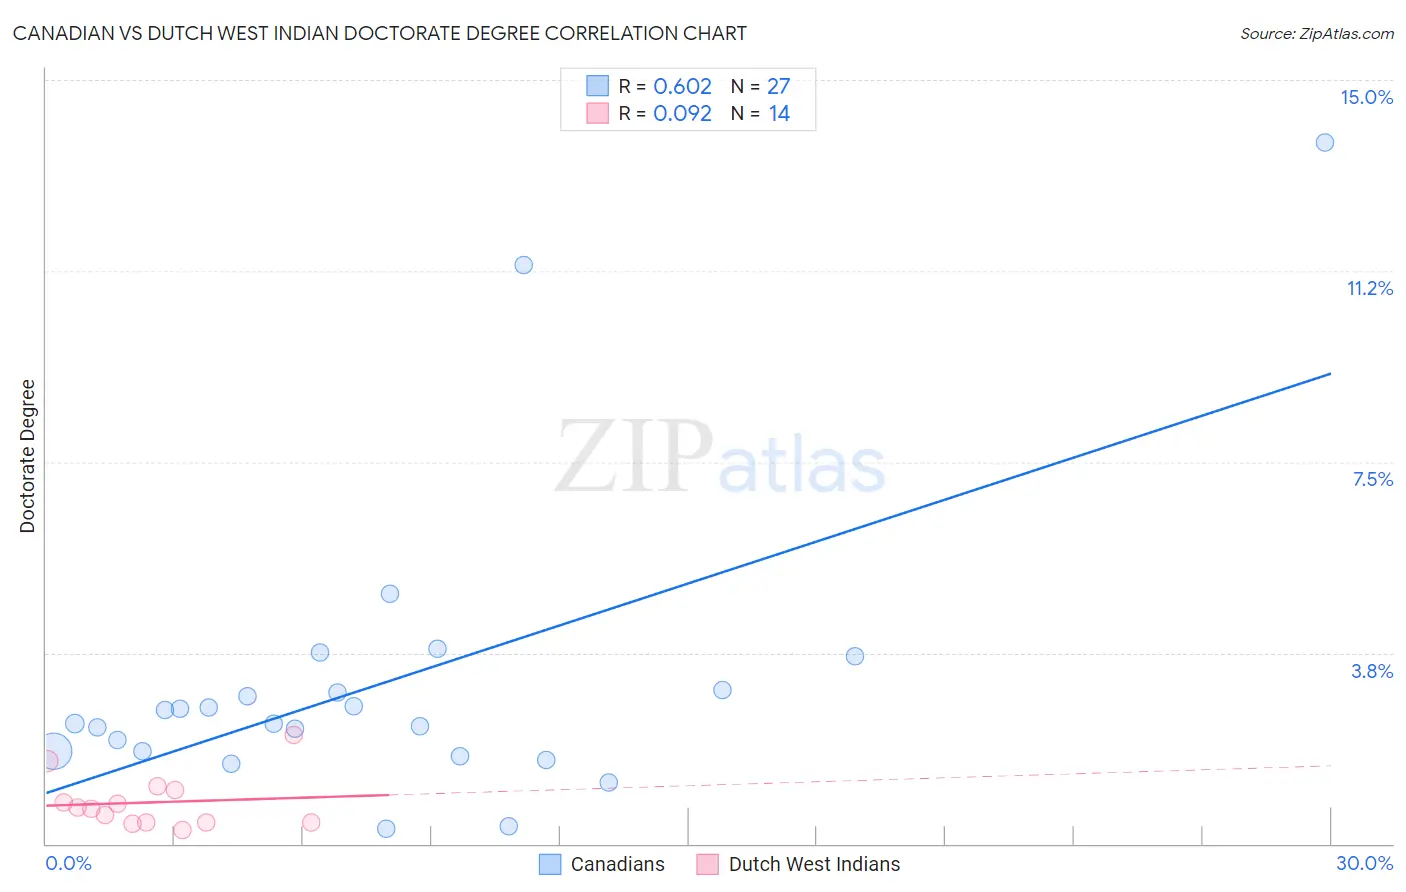
Canadian vs Dutch West Indian Doctorate Degree Correlation Chart
The statistical analysis conducted on geographies consisting of 431,466,158 people shows a significant positive correlation between the proportion of Canadians and percentage of population with at least doctorate degree education in the United States with a correlation coefficient (R) of 0.602 and weighted average of 2.0%. Similarly, the statistical analysis conducted on geographies consisting of 84,429,780 people shows a slight positive correlation between the proportion of Dutch West Indians and percentage of population with at least doctorate degree education in the United States with a correlation coefficient (R) of 0.092 and weighted average of 1.3%, a difference of 49.5%.
Doctorate Degree Correlation Summary
| Measurement | Canadian | Dutch West Indian |
| Minimum | 0.28% | 0.26% |
| Maximum | 13.8% | 2.1% |
| Range | 13.5% | 1.9% |
| Mean | 3.1% | 0.81% |
| Median | 2.4% | 0.70% |
| Interquartile 25% (IQ1) | 1.8% | 0.41% |
| Interquartile 75% (IQ3) | 3.0% | 1.1% |
| Interquartile Range (IQR) | 1.2% | 0.65% |
| Standard Deviation (Sample) | 2.9% | 0.53% |
| Standard Deviation (Population) | 2.9% | 0.51% |
Similar Demographics by Doctorate Degree
Demographics Similar to Canadians by Doctorate Degree
In terms of doctorate degree, the demographic groups most similar to Canadians are Immigrants from Ukraine (2.0%, a difference of 0.010%), Immigrants from Sierra Leone (2.0%, a difference of 0.14%), Immigrants from Zaire (2.0%, a difference of 0.22%), Scottish (2.0%, a difference of 0.42%), and Immigrants from Uzbekistan (2.0%, a difference of 0.47%).
| Demographics | Rating | Rank | Doctorate Degree |
| Immigrants | Southern Europe | 94.7 /100 | #122 | Exceptional 2.0% |
| Croatians | 94.0 /100 | #123 | Exceptional 2.0% |
| Ute | 93.2 /100 | #124 | Exceptional 2.0% |
| Moroccans | 93.0 /100 | #125 | Exceptional 2.0% |
| Jordanians | 92.1 /100 | #126 | Exceptional 2.0% |
| Palestinians | 92.0 /100 | #127 | Exceptional 2.0% |
| Immigrants | Zaire | 91.1 /100 | #128 | Exceptional 2.0% |
| Canadians | 90.6 /100 | #129 | Exceptional 2.0% |
| Immigrants | Ukraine | 90.5 /100 | #130 | Exceptional 2.0% |
| Immigrants | Sierra Leone | 90.2 /100 | #131 | Exceptional 2.0% |
| Scottish | 89.4 /100 | #132 | Excellent 2.0% |
| Immigrants | Uzbekistan | 89.3 /100 | #133 | Excellent 2.0% |
| Immigrants | Cameroon | 88.9 /100 | #134 | Excellent 2.0% |
| Serbians | 88.7 /100 | #135 | Excellent 2.0% |
| Swedes | 88.3 /100 | #136 | Excellent 2.0% |
Demographics Similar to Dutch West Indians by Doctorate Degree
In terms of doctorate degree, the demographic groups most similar to Dutch West Indians are Seminole (1.3%, a difference of 0.060%), Immigrants from St. Vincent and the Grenadines (1.3%, a difference of 0.11%), Immigrants from Guyana (1.3%, a difference of 0.17%), Immigrants from Belize (1.3%, a difference of 0.26%), and Native/Alaskan (1.3%, a difference of 0.58%).
| Demographics | Rating | Rank | Doctorate Degree |
| Dominicans | 0.1 /100 | #314 | Tragic 1.4% |
| Immigrants | Azores | 0.1 /100 | #315 | Tragic 1.4% |
| Navajo | 0.1 /100 | #316 | Tragic 1.4% |
| Immigrants | Micronesia | 0.1 /100 | #317 | Tragic 1.3% |
| Creek | 0.1 /100 | #318 | Tragic 1.3% |
| Immigrants | Guyana | 0.1 /100 | #319 | Tragic 1.3% |
| Immigrants | St. Vincent and the Grenadines | 0.1 /100 | #320 | Tragic 1.3% |
| Dutch West Indians | 0.1 /100 | #321 | Tragic 1.3% |
| Seminole | 0.1 /100 | #322 | Tragic 1.3% |
| Immigrants | Belize | 0.1 /100 | #323 | Tragic 1.3% |
| Natives/Alaskans | 0.0 /100 | #324 | Tragic 1.3% |
| Pima | 0.0 /100 | #325 | Tragic 1.3% |
| Immigrants | Cabo Verde | 0.0 /100 | #326 | Tragic 1.3% |
| Hispanics or Latinos | 0.0 /100 | #327 | Tragic 1.3% |
| Inupiat | 0.0 /100 | #328 | Tragic 1.3% |