Nepalese vs Dutch West Indian Householder Income Ages 45 - 64 years
COMPARE
Nepalese
Dutch West Indian
Householder Income Ages 45 - 64 years
Householder Income Ages 45 - 64 years Comparison
Nepalese
Dutch West Indians
$93,355
HOUSEHOLDER INCOME AGES 45 - 64 YEARS
3.0/ 100
METRIC RATING
233rd/ 347
METRIC RANK
$79,171
HOUSEHOLDER INCOME AGES 45 - 64 YEARS
0.0/ 100
METRIC RATING
329th/ 347
METRIC RANK
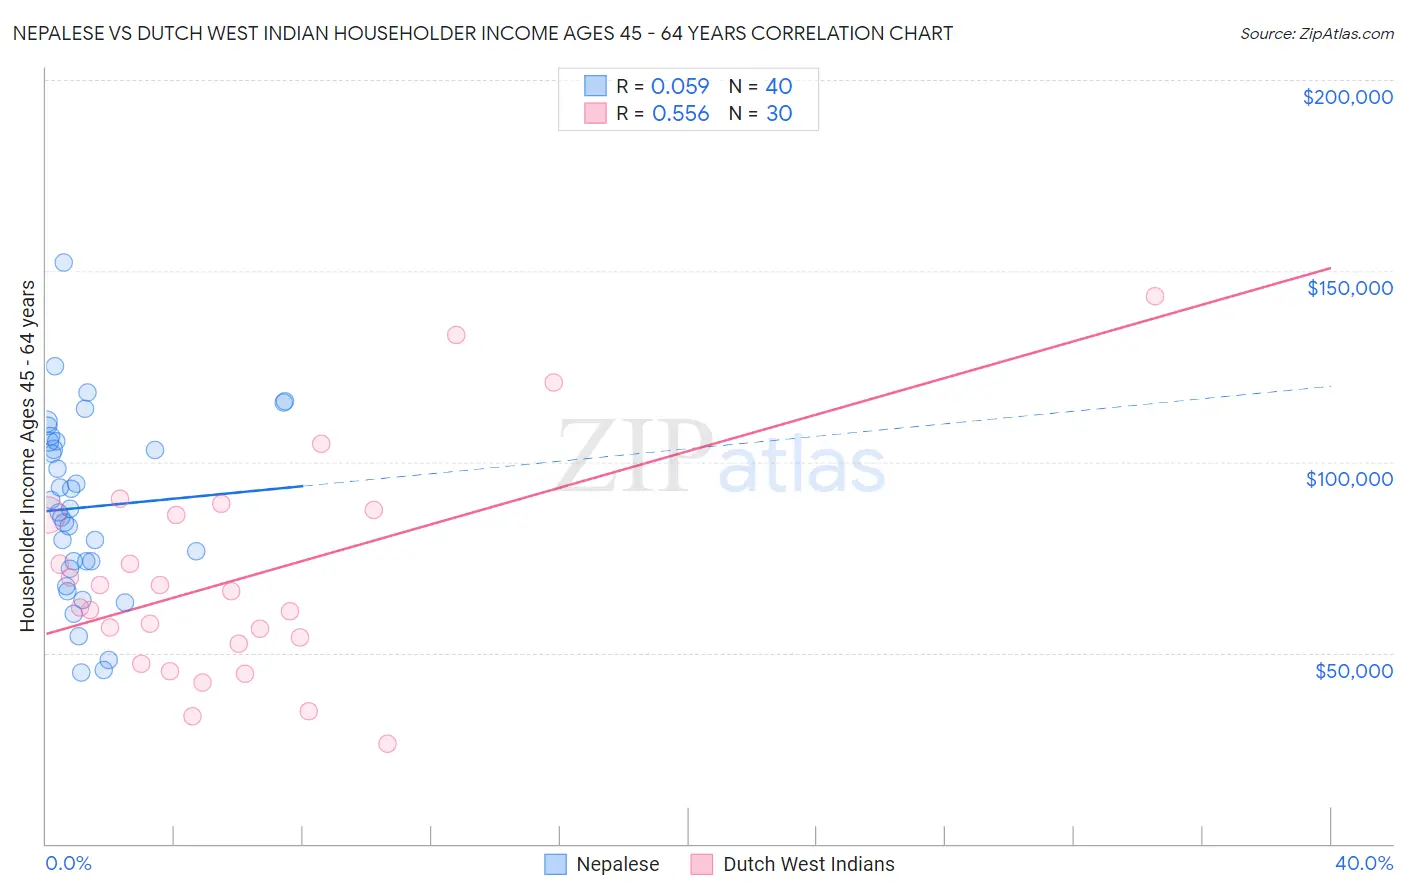
Nepalese vs Dutch West Indian Householder Income Ages 45 - 64 years Correlation Chart
The statistical analysis conducted on geographies consisting of 24,521,755 people shows a slight positive correlation between the proportion of Nepalese and household income with householder between the ages 45 and 64 in the United States with a correlation coefficient (R) of 0.059 and weighted average of $93,355. Similarly, the statistical analysis conducted on geographies consisting of 85,713,133 people shows a substantial positive correlation between the proportion of Dutch West Indians and household income with householder between the ages 45 and 64 in the United States with a correlation coefficient (R) of 0.556 and weighted average of $79,171, a difference of 17.9%.
Householder Income Ages 45 - 64 years Correlation Summary
| Measurement | Nepalese | Dutch West Indian |
| Minimum | $44,758 | $26,250 |
| Maximum | $152,367 | $143,214 |
| Range | $107,609 | $116,964 |
| Mean | $88,143 | $69,746 |
| Median | $87,241 | $63,988 |
| Interquartile 25% (IQ1) | $72,874 | $52,500 |
| Interquartile 75% (IQ3) | $105,294 | $86,138 |
| Interquartile Range (IQR) | $32,420 | $33,638 |
| Standard Deviation (Sample) | $23,682 | $28,236 |
| Standard Deviation (Population) | $23,385 | $27,762 |
Similar Demographics by Householder Income Ages 45 - 64 years
Demographics Similar to Nepalese by Householder Income Ages 45 - 64 years
In terms of householder income ages 45 - 64 years, the demographic groups most similar to Nepalese are Immigrants from El Salvador ($93,176, a difference of 0.19%), Sudanese ($93,718, a difference of 0.39%), Ecuadorian ($93,739, a difference of 0.41%), Vietnamese ($93,788, a difference of 0.46%), and Immigrants from Sudan ($93,781, a difference of 0.46%).
| Demographics | Rating | Rank | Householder Income Ages 45 - 64 years |
| Immigrants | Azores | 4.3 /100 | #226 | Tragic $94,138 |
| Alaska Natives | 4.0 /100 | #227 | Tragic $93,991 |
| Immigrants | Panama | 3.7 /100 | #228 | Tragic $93,815 |
| Vietnamese | 3.6 /100 | #229 | Tragic $93,788 |
| Immigrants | Sudan | 3.6 /100 | #230 | Tragic $93,781 |
| Ecuadorians | 3.6 /100 | #231 | Tragic $93,739 |
| Sudanese | 3.5 /100 | #232 | Tragic $93,718 |
| Nepalese | 3.0 /100 | #233 | Tragic $93,355 |
| Immigrants | El Salvador | 2.7 /100 | #234 | Tragic $93,176 |
| Nicaraguans | 2.0 /100 | #235 | Tragic $92,554 |
| Immigrants | Western Africa | 1.8 /100 | #236 | Tragic $92,384 |
| Immigrants | Bangladesh | 1.7 /100 | #237 | Tragic $92,208 |
| Pennsylvania Germans | 1.5 /100 | #238 | Tragic $91,956 |
| Immigrants | Ecuador | 1.2 /100 | #239 | Tragic $91,462 |
| Immigrants | Burma/Myanmar | 1.1 /100 | #240 | Tragic $91,385 |
Demographics Similar to Dutch West Indians by Householder Income Ages 45 - 64 years
In terms of householder income ages 45 - 64 years, the demographic groups most similar to Dutch West Indians are Creek ($78,960, a difference of 0.27%), Immigrants from Dominican Republic ($78,836, a difference of 0.42%), Black/African American ($78,556, a difference of 0.78%), Native/Alaskan ($79,816, a difference of 0.82%), and Seminole ($80,077, a difference of 1.1%).
| Demographics | Rating | Rank | Householder Income Ages 45 - 64 years |
| Sioux | 0.0 /100 | #322 | Tragic $81,750 |
| Bahamians | 0.0 /100 | #323 | Tragic $81,369 |
| Yup'ik | 0.0 /100 | #324 | Tragic $81,000 |
| Immigrants | Cuba | 0.0 /100 | #325 | Tragic $80,662 |
| Dominicans | 0.0 /100 | #326 | Tragic $80,623 |
| Seminole | 0.0 /100 | #327 | Tragic $80,077 |
| Natives/Alaskans | 0.0 /100 | #328 | Tragic $79,816 |
| Dutch West Indians | 0.0 /100 | #329 | Tragic $79,171 |
| Creek | 0.0 /100 | #330 | Tragic $78,960 |
| Immigrants | Dominican Republic | 0.0 /100 | #331 | Tragic $78,836 |
| Blacks/African Americans | 0.0 /100 | #332 | Tragic $78,556 |
| Immigrants | Congo | 0.0 /100 | #333 | Tragic $77,850 |
| Menominee | 0.0 /100 | #334 | Tragic $76,903 |
| Cheyenne | 0.0 /100 | #335 | Tragic $76,362 |
| Arapaho | 0.0 /100 | #336 | Tragic $75,945 |