Crow vs Dutch West Indian Doctorate Degree
COMPARE
Crow
Dutch West Indian
Doctorate Degree
Doctorate Degree Comparison
Crow
Dutch West Indians
1.5%
DOCTORATE DEGREE
0.5/ 100
METRIC RATING
269th/ 347
METRIC RANK
1.3%
DOCTORATE DEGREE
0.1/ 100
METRIC RATING
321st/ 347
METRIC RANK
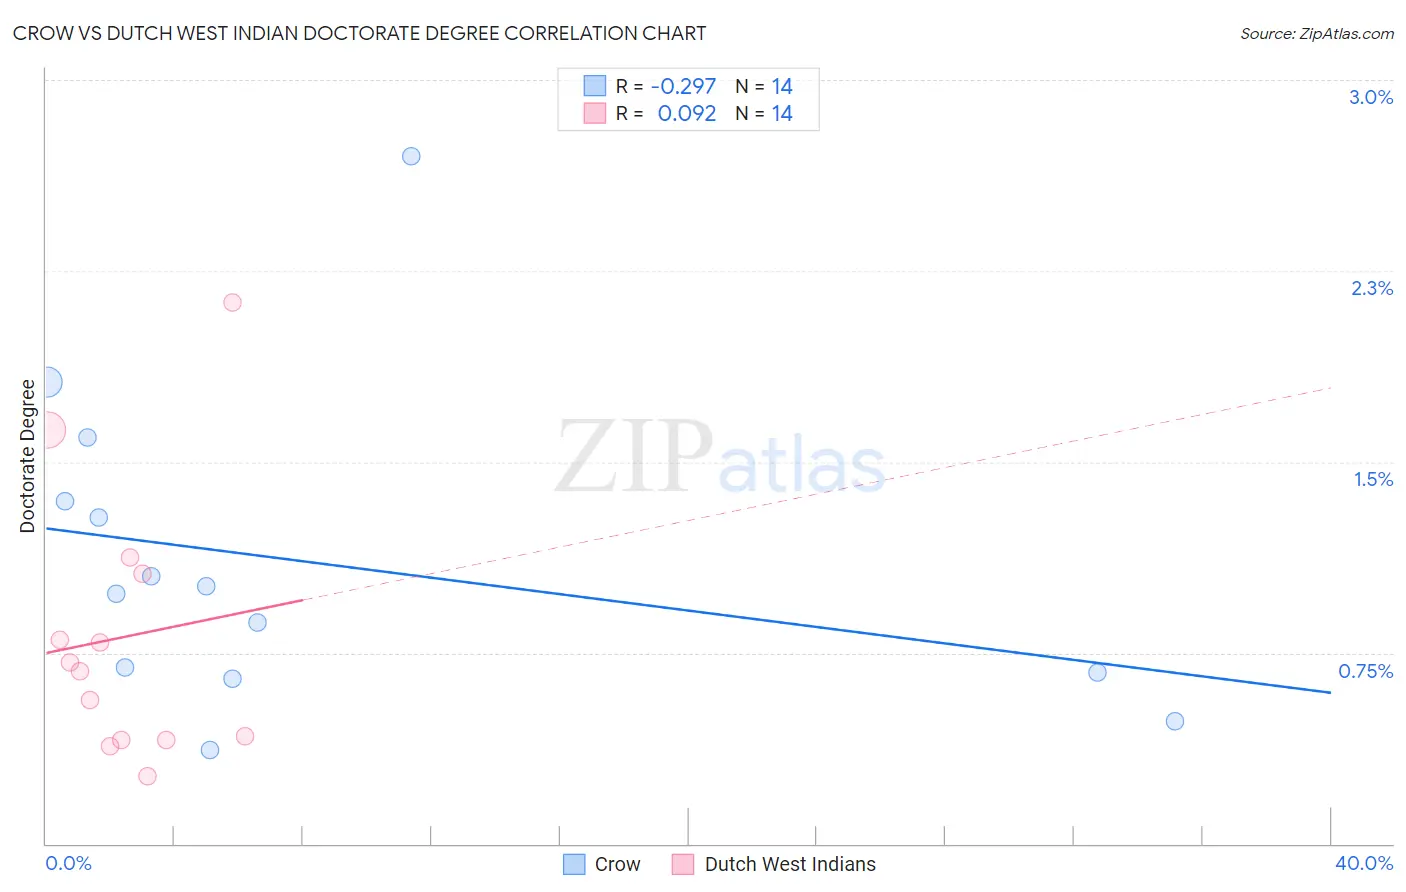
Crow vs Dutch West Indian Doctorate Degree Correlation Chart
The statistical analysis conducted on geographies consisting of 58,797,777 people shows a weak negative correlation between the proportion of Crow and percentage of population with at least doctorate degree education in the United States with a correlation coefficient (R) of -0.297 and weighted average of 1.5%. Similarly, the statistical analysis conducted on geographies consisting of 84,429,780 people shows a slight positive correlation between the proportion of Dutch West Indians and percentage of population with at least doctorate degree education in the United States with a correlation coefficient (R) of 0.092 and weighted average of 1.3%, a difference of 11.0%.
Doctorate Degree Correlation Summary
| Measurement | Crow | Dutch West Indian |
| Minimum | 0.37% | 0.26% |
| Maximum | 2.7% | 2.1% |
| Range | 2.3% | 1.9% |
| Mean | 1.1% | 0.81% |
| Median | 1.00% | 0.70% |
| Interquartile 25% (IQ1) | 0.67% | 0.41% |
| Interquartile 75% (IQ3) | 1.3% | 1.1% |
| Interquartile Range (IQR) | 0.67% | 0.65% |
| Standard Deviation (Sample) | 0.62% | 0.53% |
| Standard Deviation (Population) | 0.60% | 0.51% |
Similar Demographics by Doctorate Degree
Demographics Similar to Crow by Doctorate Degree
In terms of doctorate degree, the demographic groups most similar to Crow are Salvadoran (1.5%, a difference of 0.030%), Kiowa (1.5%, a difference of 0.090%), U.S. Virgin Islander (1.5%, a difference of 0.090%), Immigrants from Trinidad and Tobago (1.5%, a difference of 0.10%), and Immigrants from Barbados (1.5%, a difference of 0.19%).
| Demographics | Rating | Rank | Doctorate Degree |
| Chickasaw | 0.7 /100 | #262 | Tragic 1.5% |
| Immigrants | Bahamas | 0.7 /100 | #263 | Tragic 1.5% |
| Blackfeet | 0.7 /100 | #264 | Tragic 1.5% |
| Nicaraguans | 0.6 /100 | #265 | Tragic 1.5% |
| Immigrants | Liberia | 0.5 /100 | #266 | Tragic 1.5% |
| Kiowa | 0.5 /100 | #267 | Tragic 1.5% |
| U.S. Virgin Islanders | 0.5 /100 | #268 | Tragic 1.5% |
| Crow | 0.5 /100 | #269 | Tragic 1.5% |
| Salvadorans | 0.5 /100 | #270 | Tragic 1.5% |
| Immigrants | Trinidad and Tobago | 0.5 /100 | #271 | Tragic 1.5% |
| Immigrants | Barbados | 0.4 /100 | #272 | Tragic 1.5% |
| Sioux | 0.4 /100 | #273 | Tragic 1.5% |
| Yaqui | 0.4 /100 | #274 | Tragic 1.5% |
| Aleuts | 0.4 /100 | #275 | Tragic 1.5% |
| Paiute | 0.4 /100 | #276 | Tragic 1.5% |
Demographics Similar to Dutch West Indians by Doctorate Degree
In terms of doctorate degree, the demographic groups most similar to Dutch West Indians are Seminole (1.3%, a difference of 0.060%), Immigrants from St. Vincent and the Grenadines (1.3%, a difference of 0.11%), Immigrants from Guyana (1.3%, a difference of 0.17%), Immigrants from Belize (1.3%, a difference of 0.26%), and Native/Alaskan (1.3%, a difference of 0.58%).
| Demographics | Rating | Rank | Doctorate Degree |
| Dominicans | 0.1 /100 | #314 | Tragic 1.4% |
| Immigrants | Azores | 0.1 /100 | #315 | Tragic 1.4% |
| Navajo | 0.1 /100 | #316 | Tragic 1.4% |
| Immigrants | Micronesia | 0.1 /100 | #317 | Tragic 1.3% |
| Creek | 0.1 /100 | #318 | Tragic 1.3% |
| Immigrants | Guyana | 0.1 /100 | #319 | Tragic 1.3% |
| Immigrants | St. Vincent and the Grenadines | 0.1 /100 | #320 | Tragic 1.3% |
| Dutch West Indians | 0.1 /100 | #321 | Tragic 1.3% |
| Seminole | 0.1 /100 | #322 | Tragic 1.3% |
| Immigrants | Belize | 0.1 /100 | #323 | Tragic 1.3% |
| Natives/Alaskans | 0.0 /100 | #324 | Tragic 1.3% |
| Pima | 0.0 /100 | #325 | Tragic 1.3% |
| Immigrants | Cabo Verde | 0.0 /100 | #326 | Tragic 1.3% |
| Hispanics or Latinos | 0.0 /100 | #327 | Tragic 1.3% |
| Inupiat | 0.0 /100 | #328 | Tragic 1.3% |