Navajo vs Immigrants from Hong Kong College, 1 year or more
COMPARE
Navajo
Immigrants from Hong Kong
College, 1 year or more
College, 1 year or more Comparison
Navajo
Immigrants from Hong Kong
50.8%
COLLEGE, 1 YEAR OR MORE
0.0/ 100
METRIC RATING
322nd/ 347
METRIC RANK
66.4%
COLLEGE, 1 YEAR OR MORE
100.0/ 100
METRIC RATING
21st/ 347
METRIC RANK
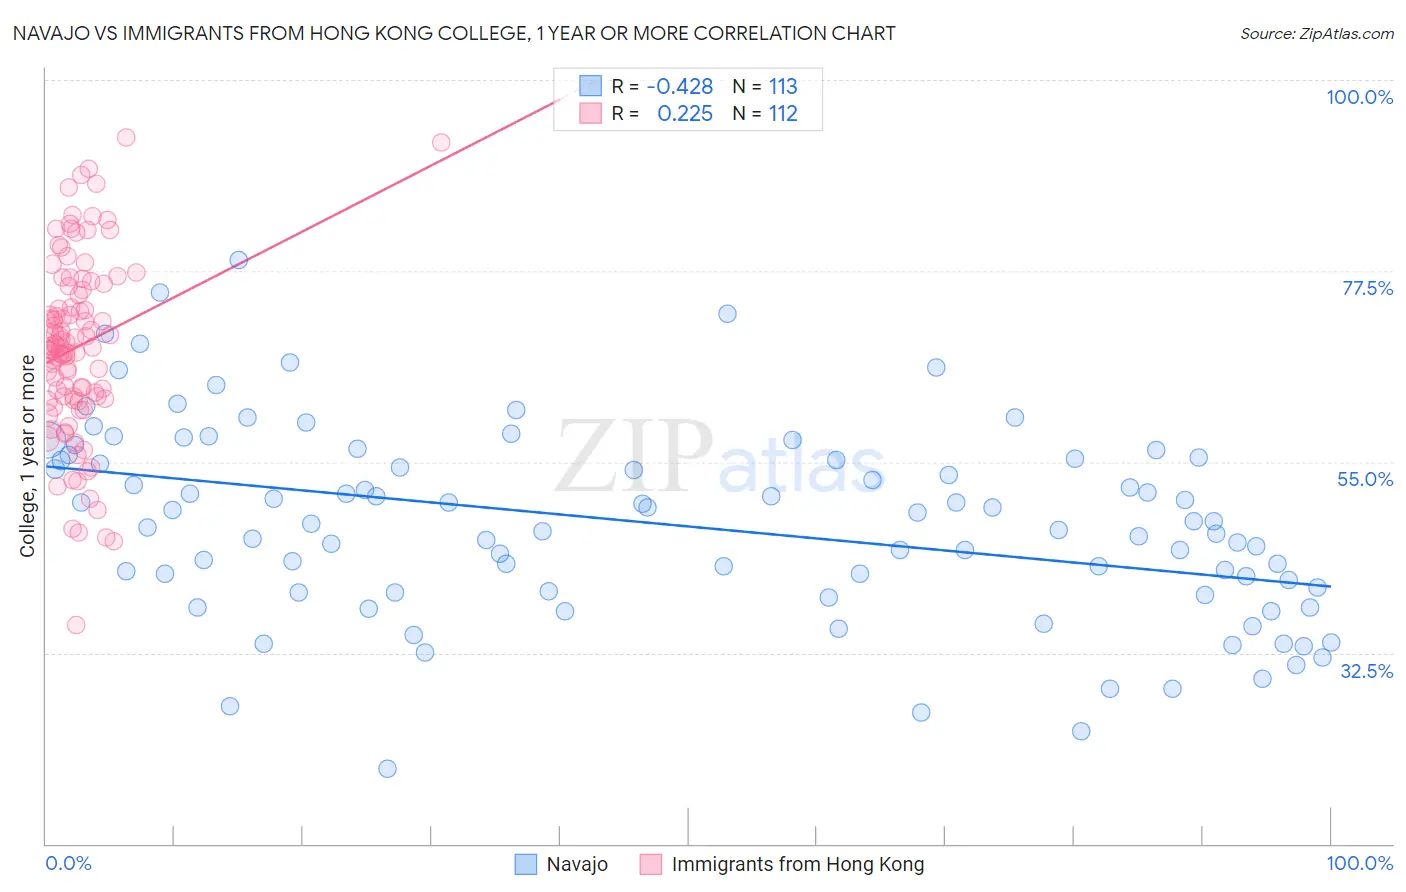
Navajo vs Immigrants from Hong Kong College, 1 year or more Correlation Chart
The statistical analysis conducted on geographies consisting of 224,872,239 people shows a moderate negative correlation between the proportion of Navajo and percentage of population with at least college, 1 year or more education in the United States with a correlation coefficient (R) of -0.428 and weighted average of 50.8%. Similarly, the statistical analysis conducted on geographies consisting of 253,990,250 people shows a weak positive correlation between the proportion of Immigrants from Hong Kong and percentage of population with at least college, 1 year or more education in the United States with a correlation coefficient (R) of 0.225 and weighted average of 66.4%, a difference of 30.8%.
College, 1 year or more Correlation Summary
| Measurement | Navajo | Immigrants from Hong Kong |
| Minimum | 18.9% | 35.8% |
| Maximum | 78.7% | 93.3% |
| Range | 59.8% | 57.4% |
| Mean | 47.6% | 68.5% |
| Median | 47.7% | 68.6% |
| Interquartile 25% (IQ1) | 39.7% | 62.6% |
| Interquartile 75% (IQ3) | 55.3% | 75.5% |
| Interquartile Range (IQR) | 15.6% | 12.9% |
| Standard Deviation (Sample) | 11.4% | 10.6% |
| Standard Deviation (Population) | 11.3% | 10.6% |
Similar Demographics by College, 1 year or more
Demographics Similar to Navajo by College, 1 year or more
In terms of college, 1 year or more, the demographic groups most similar to Navajo are Hopi (50.9%, a difference of 0.18%), Immigrants from Guatemala (50.7%, a difference of 0.23%), Immigrants from Cuba (50.7%, a difference of 0.24%), Immigrants from Latin America (50.7%, a difference of 0.27%), and Kiowa (51.0%, a difference of 0.31%).
| Demographics | Rating | Rank | College, 1 year or more |
| Guatemalans | 0.0 /100 | #315 | Tragic 51.2% |
| Cajuns | 0.0 /100 | #316 | Tragic 51.2% |
| Hispanics or Latinos | 0.0 /100 | #317 | Tragic 51.1% |
| Immigrants | Honduras | 0.0 /100 | #318 | Tragic 51.0% |
| Immigrants | El Salvador | 0.0 /100 | #319 | Tragic 51.0% |
| Kiowa | 0.0 /100 | #320 | Tragic 51.0% |
| Hopi | 0.0 /100 | #321 | Tragic 50.9% |
| Navajo | 0.0 /100 | #322 | Tragic 50.8% |
| Immigrants | Guatemala | 0.0 /100 | #323 | Tragic 50.7% |
| Immigrants | Cuba | 0.0 /100 | #324 | Tragic 50.7% |
| Immigrants | Latin America | 0.0 /100 | #325 | Tragic 50.7% |
| Dominicans | 0.0 /100 | #326 | Tragic 50.6% |
| Menominee | 0.0 /100 | #327 | Tragic 50.6% |
| Dutch West Indians | 0.0 /100 | #328 | Tragic 50.5% |
| Cape Verdeans | 0.0 /100 | #329 | Tragic 50.3% |
Demographics Similar to Immigrants from Hong Kong by College, 1 year or more
In terms of college, 1 year or more, the demographic groups most similar to Immigrants from Hong Kong are Soviet Union (66.4%, a difference of 0.060%), Immigrants from Korea (66.5%, a difference of 0.070%), Immigrants from Switzerland (66.5%, a difference of 0.11%), Immigrants from China (66.4%, a difference of 0.12%), and Eastern European (66.6%, a difference of 0.16%).
| Demographics | Rating | Rank | College, 1 year or more |
| Burmese | 100.0 /100 | #14 | Exceptional 66.7% |
| Cambodians | 100.0 /100 | #15 | Exceptional 66.7% |
| Immigrants | Japan | 100.0 /100 | #16 | Exceptional 66.7% |
| Immigrants | Eastern Asia | 100.0 /100 | #17 | Exceptional 66.6% |
| Eastern Europeans | 100.0 /100 | #18 | Exceptional 66.6% |
| Immigrants | Switzerland | 100.0 /100 | #19 | Exceptional 66.5% |
| Immigrants | Korea | 100.0 /100 | #20 | Exceptional 66.5% |
| Immigrants | Hong Kong | 100.0 /100 | #21 | Exceptional 66.4% |
| Soviet Union | 100.0 /100 | #22 | Exceptional 66.4% |
| Immigrants | China | 100.0 /100 | #23 | Exceptional 66.4% |
| Immigrants | Belgium | 100.0 /100 | #24 | Exceptional 66.3% |
| Indians (Asian) | 100.0 /100 | #25 | Exceptional 66.1% |
| Latvians | 100.0 /100 | #26 | Exceptional 66.1% |
| Immigrants | Ireland | 100.0 /100 | #27 | Exceptional 65.9% |
| Immigrants | France | 100.0 /100 | #28 | Exceptional 65.8% |