Navajo vs Serbian College, 1 year or more
COMPARE
Navajo
Serbian
College, 1 year or more
College, 1 year or more Comparison
Navajo
Serbians
50.8%
COLLEGE, 1 YEAR OR MORE
0.0/ 100
METRIC RATING
322nd/ 347
METRIC RANK
61.4%
COLLEGE, 1 YEAR OR MORE
92.2/ 100
METRIC RATING
123rd/ 347
METRIC RANK
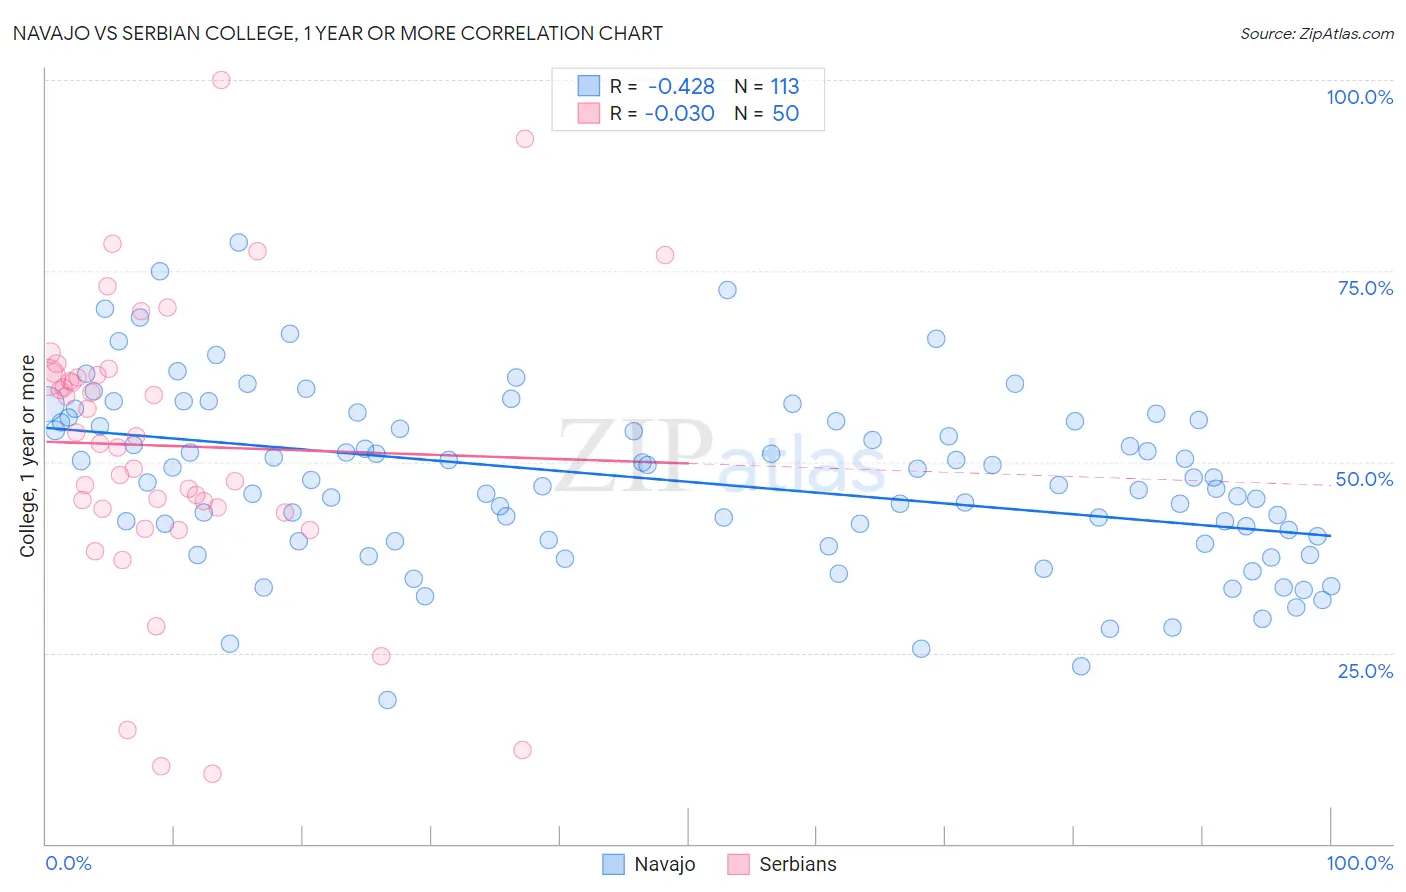
Navajo vs Serbian College, 1 year or more Correlation Chart
The statistical analysis conducted on geographies consisting of 224,872,239 people shows a moderate negative correlation between the proportion of Navajo and percentage of population with at least college, 1 year or more education in the United States with a correlation coefficient (R) of -0.428 and weighted average of 50.8%. Similarly, the statistical analysis conducted on geographies consisting of 267,640,905 people shows no correlation between the proportion of Serbians and percentage of population with at least college, 1 year or more education in the United States with a correlation coefficient (R) of -0.030 and weighted average of 61.4%, a difference of 20.7%.
College, 1 year or more Correlation Summary
| Measurement | Navajo | Serbian |
| Minimum | 18.9% | 9.2% |
| Maximum | 78.7% | 100.0% |
| Range | 59.8% | 90.8% |
| Mean | 47.6% | 52.1% |
| Median | 47.7% | 52.9% |
| Interquartile 25% (IQ1) | 39.7% | 43.9% |
| Interquartile 75% (IQ3) | 55.3% | 61.3% |
| Interquartile Range (IQR) | 15.6% | 17.4% |
| Standard Deviation (Sample) | 11.4% | 18.8% |
| Standard Deviation (Population) | 11.3% | 18.6% |
Similar Demographics by College, 1 year or more
Demographics Similar to Navajo by College, 1 year or more
In terms of college, 1 year or more, the demographic groups most similar to Navajo are Hopi (50.9%, a difference of 0.18%), Immigrants from Guatemala (50.7%, a difference of 0.23%), Immigrants from Cuba (50.7%, a difference of 0.24%), Immigrants from Latin America (50.7%, a difference of 0.27%), and Kiowa (51.0%, a difference of 0.31%).
| Demographics | Rating | Rank | College, 1 year or more |
| Guatemalans | 0.0 /100 | #315 | Tragic 51.2% |
| Cajuns | 0.0 /100 | #316 | Tragic 51.2% |
| Hispanics or Latinos | 0.0 /100 | #317 | Tragic 51.1% |
| Immigrants | Honduras | 0.0 /100 | #318 | Tragic 51.0% |
| Immigrants | El Salvador | 0.0 /100 | #319 | Tragic 51.0% |
| Kiowa | 0.0 /100 | #320 | Tragic 51.0% |
| Hopi | 0.0 /100 | #321 | Tragic 50.9% |
| Navajo | 0.0 /100 | #322 | Tragic 50.8% |
| Immigrants | Guatemala | 0.0 /100 | #323 | Tragic 50.7% |
| Immigrants | Cuba | 0.0 /100 | #324 | Tragic 50.7% |
| Immigrants | Latin America | 0.0 /100 | #325 | Tragic 50.7% |
| Dominicans | 0.0 /100 | #326 | Tragic 50.6% |
| Menominee | 0.0 /100 | #327 | Tragic 50.6% |
| Dutch West Indians | 0.0 /100 | #328 | Tragic 50.5% |
| Cape Verdeans | 0.0 /100 | #329 | Tragic 50.3% |
Demographics Similar to Serbians by College, 1 year or more
In terms of college, 1 year or more, the demographic groups most similar to Serbians are Immigrants from Chile (61.4%, a difference of 0.010%), Venezuelan (61.3%, a difference of 0.030%), Immigrants from Jordan (61.4%, a difference of 0.10%), Immigrants from Syria (61.3%, a difference of 0.11%), and Alsatian (61.3%, a difference of 0.15%).
| Demographics | Rating | Rank | College, 1 year or more |
| Lebanese | 94.1 /100 | #116 | Exceptional 61.6% |
| Arabs | 93.9 /100 | #117 | Exceptional 61.6% |
| Immigrants | Brazil | 93.9 /100 | #118 | Exceptional 61.6% |
| Assyrians/Chaldeans/Syriacs | 93.3 /100 | #119 | Exceptional 61.5% |
| Pakistanis | 93.2 /100 | #120 | Exceptional 61.5% |
| Immigrants | Jordan | 92.7 /100 | #121 | Exceptional 61.4% |
| Immigrants | Chile | 92.3 /100 | #122 | Exceptional 61.4% |
| Serbians | 92.2 /100 | #123 | Exceptional 61.4% |
| Venezuelans | 92.1 /100 | #124 | Exceptional 61.3% |
| Immigrants | Syria | 91.6 /100 | #125 | Exceptional 61.3% |
| Alsatians | 91.3 /100 | #126 | Exceptional 61.3% |
| Immigrants | Eastern Africa | 91.1 /100 | #127 | Exceptional 61.2% |
| Immigrants | Italy | 91.1 /100 | #128 | Exceptional 61.2% |
| Ugandans | 90.7 /100 | #129 | Exceptional 61.2% |
| Italians | 89.5 /100 | #130 | Excellent 61.1% |