Immigrants from Dominican Republic vs Immigrants from Hong Kong College, 1 year or more
COMPARE
Immigrants from Dominican Republic
Immigrants from Hong Kong
College, 1 year or more
College, 1 year or more Comparison
Immigrants from Dominican Republic
Immigrants from Hong Kong
49.1%
COLLEGE, 1 YEAR OR MORE
0.0/ 100
METRIC RATING
333rd/ 347
METRIC RANK
66.4%
COLLEGE, 1 YEAR OR MORE
100.0/ 100
METRIC RATING
21st/ 347
METRIC RANK
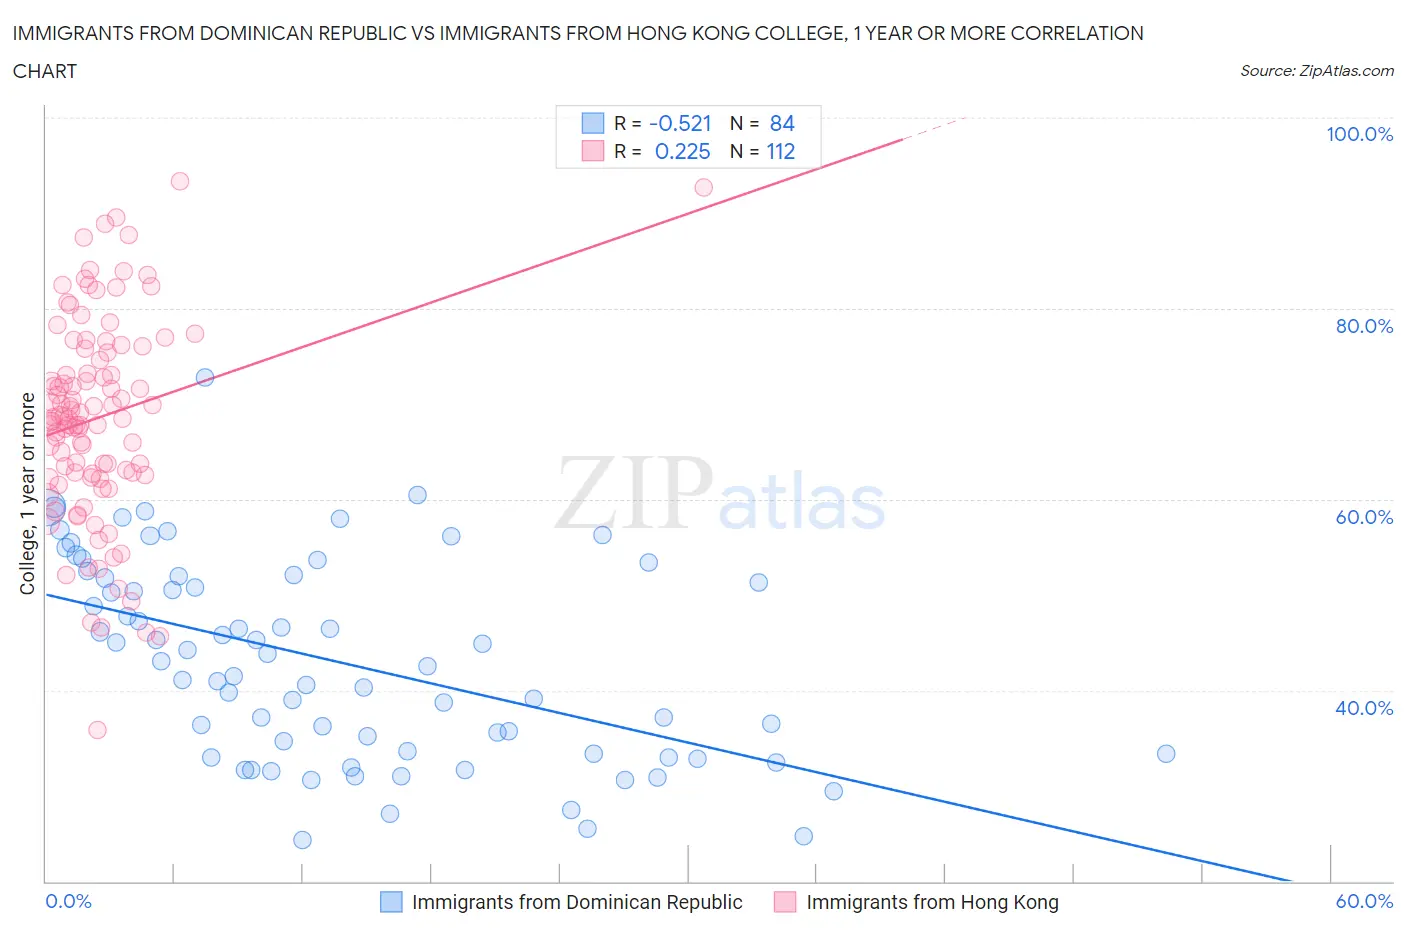
Immigrants from Dominican Republic vs Immigrants from Hong Kong College, 1 year or more Correlation Chart
The statistical analysis conducted on geographies consisting of 275,143,955 people shows a substantial negative correlation between the proportion of Immigrants from Dominican Republic and percentage of population with at least college, 1 year or more education in the United States with a correlation coefficient (R) of -0.521 and weighted average of 49.1%. Similarly, the statistical analysis conducted on geographies consisting of 253,990,250 people shows a weak positive correlation between the proportion of Immigrants from Hong Kong and percentage of population with at least college, 1 year or more education in the United States with a correlation coefficient (R) of 0.225 and weighted average of 66.4%, a difference of 35.2%.
College, 1 year or more Correlation Summary
| Measurement | Immigrants from Dominican Republic | Immigrants from Hong Kong |
| Minimum | 24.3% | 35.8% |
| Maximum | 72.7% | 93.3% |
| Range | 48.4% | 57.4% |
| Mean | 43.0% | 68.5% |
| Median | 42.7% | 68.6% |
| Interquartile 25% (IQ1) | 33.3% | 62.6% |
| Interquartile 75% (IQ3) | 51.9% | 75.5% |
| Interquartile Range (IQR) | 18.6% | 12.9% |
| Standard Deviation (Sample) | 10.5% | 10.6% |
| Standard Deviation (Population) | 10.4% | 10.6% |
Similar Demographics by College, 1 year or more
Demographics Similar to Immigrants from Dominican Republic by College, 1 year or more
In terms of college, 1 year or more, the demographic groups most similar to Immigrants from Dominican Republic are Mexican (49.2%, a difference of 0.17%), Lumbee (48.9%, a difference of 0.58%), Yuman (48.7%, a difference of 0.86%), Spanish American Indian (48.5%, a difference of 1.3%), and Pennsylvania German (48.5%, a difference of 1.3%).
| Demographics | Rating | Rank | College, 1 year or more |
| Dominicans | 0.0 /100 | #326 | Tragic 50.6% |
| Menominee | 0.0 /100 | #327 | Tragic 50.6% |
| Dutch West Indians | 0.0 /100 | #328 | Tragic 50.5% |
| Cape Verdeans | 0.0 /100 | #329 | Tragic 50.3% |
| Natives/Alaskans | 0.0 /100 | #330 | Tragic 50.2% |
| Immigrants | Yemen | 0.0 /100 | #331 | Tragic 50.0% |
| Mexicans | 0.0 /100 | #332 | Tragic 49.2% |
| Immigrants | Dominican Republic | 0.0 /100 | #333 | Tragic 49.1% |
| Lumbee | 0.0 /100 | #334 | Tragic 48.9% |
| Yuman | 0.0 /100 | #335 | Tragic 48.7% |
| Spanish American Indians | 0.0 /100 | #336 | Tragic 48.5% |
| Pennsylvania Germans | 0.0 /100 | #337 | Tragic 48.5% |
| Immigrants | Central America | 0.0 /100 | #338 | Tragic 48.5% |
| Immigrants | Azores | 0.0 /100 | #339 | Tragic 48.4% |
| Immigrants | Cabo Verde | 0.0 /100 | #340 | Tragic 48.1% |
Demographics Similar to Immigrants from Hong Kong by College, 1 year or more
In terms of college, 1 year or more, the demographic groups most similar to Immigrants from Hong Kong are Soviet Union (66.4%, a difference of 0.060%), Immigrants from Korea (66.5%, a difference of 0.070%), Immigrants from Switzerland (66.5%, a difference of 0.11%), Immigrants from China (66.4%, a difference of 0.12%), and Eastern European (66.6%, a difference of 0.16%).
| Demographics | Rating | Rank | College, 1 year or more |
| Burmese | 100.0 /100 | #14 | Exceptional 66.7% |
| Cambodians | 100.0 /100 | #15 | Exceptional 66.7% |
| Immigrants | Japan | 100.0 /100 | #16 | Exceptional 66.7% |
| Immigrants | Eastern Asia | 100.0 /100 | #17 | Exceptional 66.6% |
| Eastern Europeans | 100.0 /100 | #18 | Exceptional 66.6% |
| Immigrants | Switzerland | 100.0 /100 | #19 | Exceptional 66.5% |
| Immigrants | Korea | 100.0 /100 | #20 | Exceptional 66.5% |
| Immigrants | Hong Kong | 100.0 /100 | #21 | Exceptional 66.4% |
| Soviet Union | 100.0 /100 | #22 | Exceptional 66.4% |
| Immigrants | China | 100.0 /100 | #23 | Exceptional 66.4% |
| Immigrants | Belgium | 100.0 /100 | #24 | Exceptional 66.3% |
| Indians (Asian) | 100.0 /100 | #25 | Exceptional 66.1% |
| Latvians | 100.0 /100 | #26 | Exceptional 66.1% |
| Immigrants | Ireland | 100.0 /100 | #27 | Exceptional 65.9% |
| Immigrants | France | 100.0 /100 | #28 | Exceptional 65.8% |