Navajo vs Sierra Leonean College, 1 year or more
COMPARE
Navajo
Sierra Leonean
College, 1 year or more
College, 1 year or more Comparison
Navajo
Sierra Leoneans
50.8%
COLLEGE, 1 YEAR OR MORE
0.0/ 100
METRIC RATING
322nd/ 347
METRIC RANK
60.2%
COLLEGE, 1 YEAR OR MORE
74.1/ 100
METRIC RATING
153rd/ 347
METRIC RANK
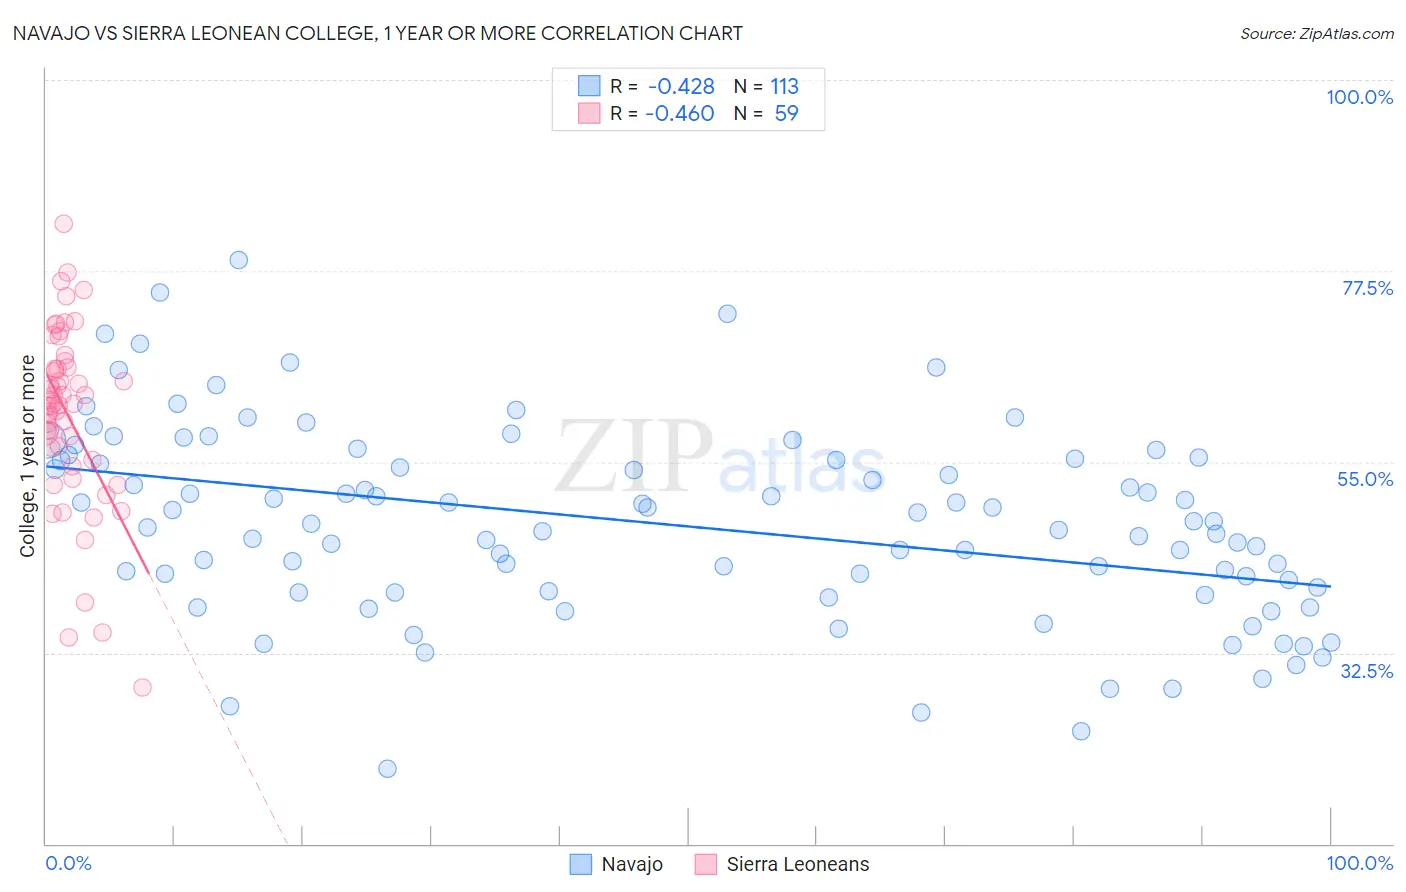
Navajo vs Sierra Leonean College, 1 year or more Correlation Chart
The statistical analysis conducted on geographies consisting of 224,872,239 people shows a moderate negative correlation between the proportion of Navajo and percentage of population with at least college, 1 year or more education in the United States with a correlation coefficient (R) of -0.428 and weighted average of 50.8%. Similarly, the statistical analysis conducted on geographies consisting of 83,362,711 people shows a moderate negative correlation between the proportion of Sierra Leoneans and percentage of population with at least college, 1 year or more education in the United States with a correlation coefficient (R) of -0.460 and weighted average of 60.2%, a difference of 18.5%.
College, 1 year or more Correlation Summary
| Measurement | Navajo | Sierra Leonean |
| Minimum | 18.9% | 28.4% |
| Maximum | 78.7% | 83.1% |
| Range | 59.8% | 54.7% |
| Mean | 47.6% | 60.5% |
| Median | 47.7% | 61.8% |
| Interquartile 25% (IQ1) | 39.7% | 55.2% |
| Interquartile 75% (IQ3) | 55.3% | 66.2% |
| Interquartile Range (IQR) | 15.6% | 11.0% |
| Standard Deviation (Sample) | 11.4% | 10.6% |
| Standard Deviation (Population) | 11.3% | 10.5% |
Similar Demographics by College, 1 year or more
Demographics Similar to Navajo by College, 1 year or more
In terms of college, 1 year or more, the demographic groups most similar to Navajo are Hopi (50.9%, a difference of 0.18%), Immigrants from Guatemala (50.7%, a difference of 0.23%), Immigrants from Cuba (50.7%, a difference of 0.24%), Immigrants from Latin America (50.7%, a difference of 0.27%), and Kiowa (51.0%, a difference of 0.31%).
| Demographics | Rating | Rank | College, 1 year or more |
| Guatemalans | 0.0 /100 | #315 | Tragic 51.2% |
| Cajuns | 0.0 /100 | #316 | Tragic 51.2% |
| Hispanics or Latinos | 0.0 /100 | #317 | Tragic 51.1% |
| Immigrants | Honduras | 0.0 /100 | #318 | Tragic 51.0% |
| Immigrants | El Salvador | 0.0 /100 | #319 | Tragic 51.0% |
| Kiowa | 0.0 /100 | #320 | Tragic 51.0% |
| Hopi | 0.0 /100 | #321 | Tragic 50.9% |
| Navajo | 0.0 /100 | #322 | Tragic 50.8% |
| Immigrants | Guatemala | 0.0 /100 | #323 | Tragic 50.7% |
| Immigrants | Cuba | 0.0 /100 | #324 | Tragic 50.7% |
| Immigrants | Latin America | 0.0 /100 | #325 | Tragic 50.7% |
| Dominicans | 0.0 /100 | #326 | Tragic 50.6% |
| Menominee | 0.0 /100 | #327 | Tragic 50.6% |
| Dutch West Indians | 0.0 /100 | #328 | Tragic 50.5% |
| Cape Verdeans | 0.0 /100 | #329 | Tragic 50.3% |
Demographics Similar to Sierra Leoneans by College, 1 year or more
In terms of college, 1 year or more, the demographic groups most similar to Sierra Leoneans are Sudanese (60.2%, a difference of 0.080%), Moroccan (60.2%, a difference of 0.080%), Finnish (60.2%, a difference of 0.080%), Immigrants from Germany (60.3%, a difference of 0.14%), and Immigrants from Sudan (60.4%, a difference of 0.27%).
| Demographics | Rating | Rank | College, 1 year or more |
| Scottish | 80.2 /100 | #146 | Excellent 60.5% |
| Immigrants | Kenya | 79.1 /100 | #147 | Good 60.5% |
| Kenyans | 79.0 /100 | #148 | Good 60.5% |
| Brazilians | 79.0 /100 | #149 | Good 60.5% |
| Immigrants | Sudan | 77.8 /100 | #150 | Good 60.4% |
| Albanians | 77.8 /100 | #151 | Good 60.4% |
| Immigrants | Germany | 76.1 /100 | #152 | Good 60.3% |
| Sierra Leoneans | 74.1 /100 | #153 | Good 60.2% |
| Sudanese | 73.0 /100 | #154 | Good 60.2% |
| Moroccans | 72.9 /100 | #155 | Good 60.2% |
| Finns | 72.9 /100 | #156 | Good 60.2% |
| Immigrants | Armenia | 68.8 /100 | #157 | Good 60.0% |
| English | 67.2 /100 | #158 | Good 60.0% |
| Immigrants | Iraq | 67.0 /100 | #159 | Good 60.0% |
| South American Indians | 66.9 /100 | #160 | Good 60.0% |