Navajo vs Immigrants from Hong Kong In Labor Force | Age 16-19
COMPARE
Navajo
Immigrants from Hong Kong
In Labor Force | Age 16-19
In Labor Force | Age 16-19 Comparison
Navajo
Immigrants from Hong Kong
32.1%
IN LABOR FORCE | AGE 16-19
0.0/ 100
METRIC RATING
308th/ 347
METRIC RANK
30.5%
IN LABOR FORCE | AGE 16-19
0.0/ 100
METRIC RATING
333rd/ 347
METRIC RANK
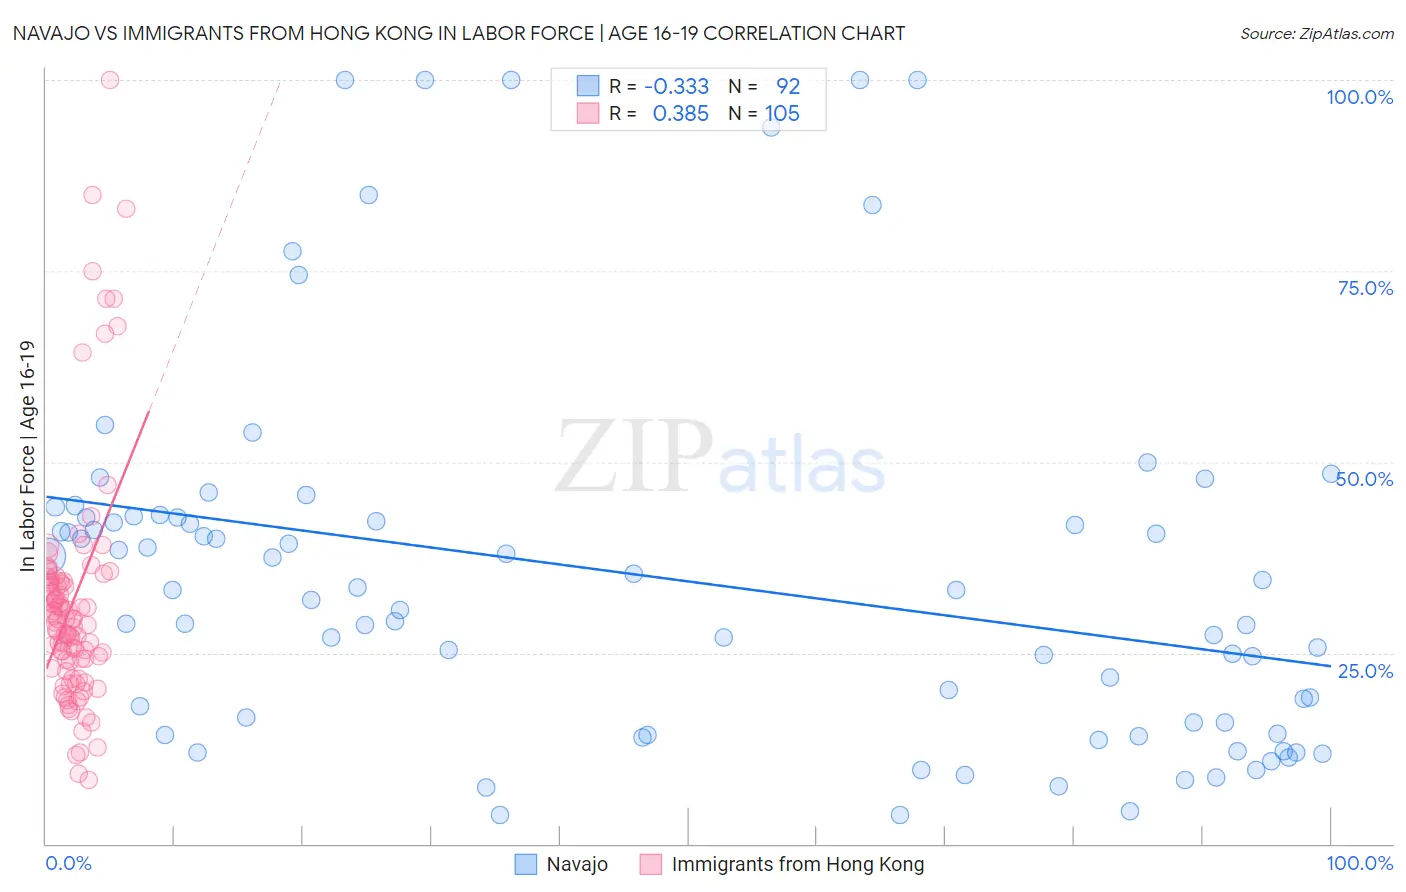
Navajo vs Immigrants from Hong Kong In Labor Force | Age 16-19 Correlation Chart
The statistical analysis conducted on geographies consisting of 224,572,215 people shows a mild negative correlation between the proportion of Navajo and labor force participation rate among population between the ages 16 and 19 in the United States with a correlation coefficient (R) of -0.333 and weighted average of 32.1%. Similarly, the statistical analysis conducted on geographies consisting of 253,714,019 people shows a mild positive correlation between the proportion of Immigrants from Hong Kong and labor force participation rate among population between the ages 16 and 19 in the United States with a correlation coefficient (R) of 0.385 and weighted average of 30.5%, a difference of 5.3%.
In Labor Force | Age 16-19 Correlation Summary
| Measurement | Navajo | Immigrants from Hong Kong |
| Minimum | 3.8% | 8.3% |
| Maximum | 100.0% | 100.0% |
| Range | 96.2% | 91.7% |
| Mean | 35.0% | 31.7% |
| Median | 32.6% | 29.4% |
| Interquartile 25% (IQ1) | 15.1% | 23.4% |
| Interquartile 75% (IQ3) | 42.8% | 34.4% |
| Interquartile Range (IQR) | 27.6% | 11.0% |
| Standard Deviation (Sample) | 24.1% | 15.8% |
| Standard Deviation (Population) | 24.0% | 15.7% |
Similar Demographics by In Labor Force | Age 16-19
Demographics Similar to Navajo by In Labor Force | Age 16-19
In terms of in labor force | age 16-19, the demographic groups most similar to Navajo are Immigrants from Eastern Asia (32.0%, a difference of 0.18%), Immigrants from Iran (32.0%, a difference of 0.32%), Immigrants from Jamaica (32.2%, a difference of 0.35%), Indian (Asian) (31.9%, a difference of 0.68%), and Immigrants from Belize (31.8%, a difference of 0.83%).
| Demographics | Rating | Rank | In Labor Force | Age 16-19 |
| Okinawans | 0.0 /100 | #301 | Tragic 32.8% |
| Belizeans | 0.0 /100 | #302 | Tragic 32.8% |
| Immigrants | Dominica | 0.0 /100 | #303 | Tragic 32.5% |
| Israelis | 0.0 /100 | #304 | Tragic 32.4% |
| Nicaraguans | 0.0 /100 | #305 | Tragic 32.4% |
| Spanish American Indians | 0.0 /100 | #306 | Tragic 32.4% |
| Immigrants | Jamaica | 0.0 /100 | #307 | Tragic 32.2% |
| Navajo | 0.0 /100 | #308 | Tragic 32.1% |
| Immigrants | Eastern Asia | 0.0 /100 | #309 | Tragic 32.0% |
| Immigrants | Iran | 0.0 /100 | #310 | Tragic 32.0% |
| Indians (Asian) | 0.0 /100 | #311 | Tragic 31.9% |
| Immigrants | Belize | 0.0 /100 | #312 | Tragic 31.8% |
| Hopi | 0.0 /100 | #313 | Tragic 31.8% |
| Cubans | 0.0 /100 | #314 | Tragic 31.8% |
| Immigrants | West Indies | 0.0 /100 | #315 | Tragic 31.7% |
Demographics Similar to Immigrants from Hong Kong by In Labor Force | Age 16-19
In terms of in labor force | age 16-19, the demographic groups most similar to Immigrants from Hong Kong are Immigrants from Israel (30.5%, a difference of 0.020%), Puerto Rican (30.3%, a difference of 0.42%), Immigrants from Cuba (30.2%, a difference of 0.75%), Immigrants from Trinidad and Tobago (30.2%, a difference of 1.0%), and Immigrants from Bangladesh (30.0%, a difference of 1.4%).
| Demographics | Rating | Rank | In Labor Force | Age 16-19 |
| Immigrants | Dominican Republic | 0.0 /100 | #326 | Tragic 31.1% |
| Immigrants | Taiwan | 0.0 /100 | #327 | Tragic 31.0% |
| Immigrants | Ecuador | 0.0 /100 | #328 | Tragic 31.0% |
| Barbadians | 0.0 /100 | #329 | Tragic 31.0% |
| Lumbee | 0.0 /100 | #330 | Tragic 31.0% |
| Trinidadians and Tobagonians | 0.0 /100 | #331 | Tragic 30.9% |
| Immigrants | Israel | 0.0 /100 | #332 | Tragic 30.5% |
| Immigrants | Hong Kong | 0.0 /100 | #333 | Tragic 30.5% |
| Puerto Ricans | 0.0 /100 | #334 | Tragic 30.3% |
| Immigrants | Cuba | 0.0 /100 | #335 | Tragic 30.2% |
| Immigrants | Trinidad and Tobago | 0.0 /100 | #336 | Tragic 30.2% |
| Immigrants | Bangladesh | 0.0 /100 | #337 | Tragic 30.0% |
| Vietnamese | 0.0 /100 | #338 | Tragic 29.6% |
| Immigrants | Uzbekistan | 0.0 /100 | #339 | Tragic 29.2% |
| British West Indians | 0.0 /100 | #340 | Tragic 29.1% |