Navajo vs Peruvian College, 1 year or more
COMPARE
Navajo
Peruvian
College, 1 year or more
College, 1 year or more Comparison
Navajo
Peruvians
50.8%
COLLEGE, 1 YEAR OR MORE
0.0/ 100
METRIC RATING
322nd/ 347
METRIC RANK
58.6%
COLLEGE, 1 YEAR OR MORE
27.5/ 100
METRIC RATING
193rd/ 347
METRIC RANK
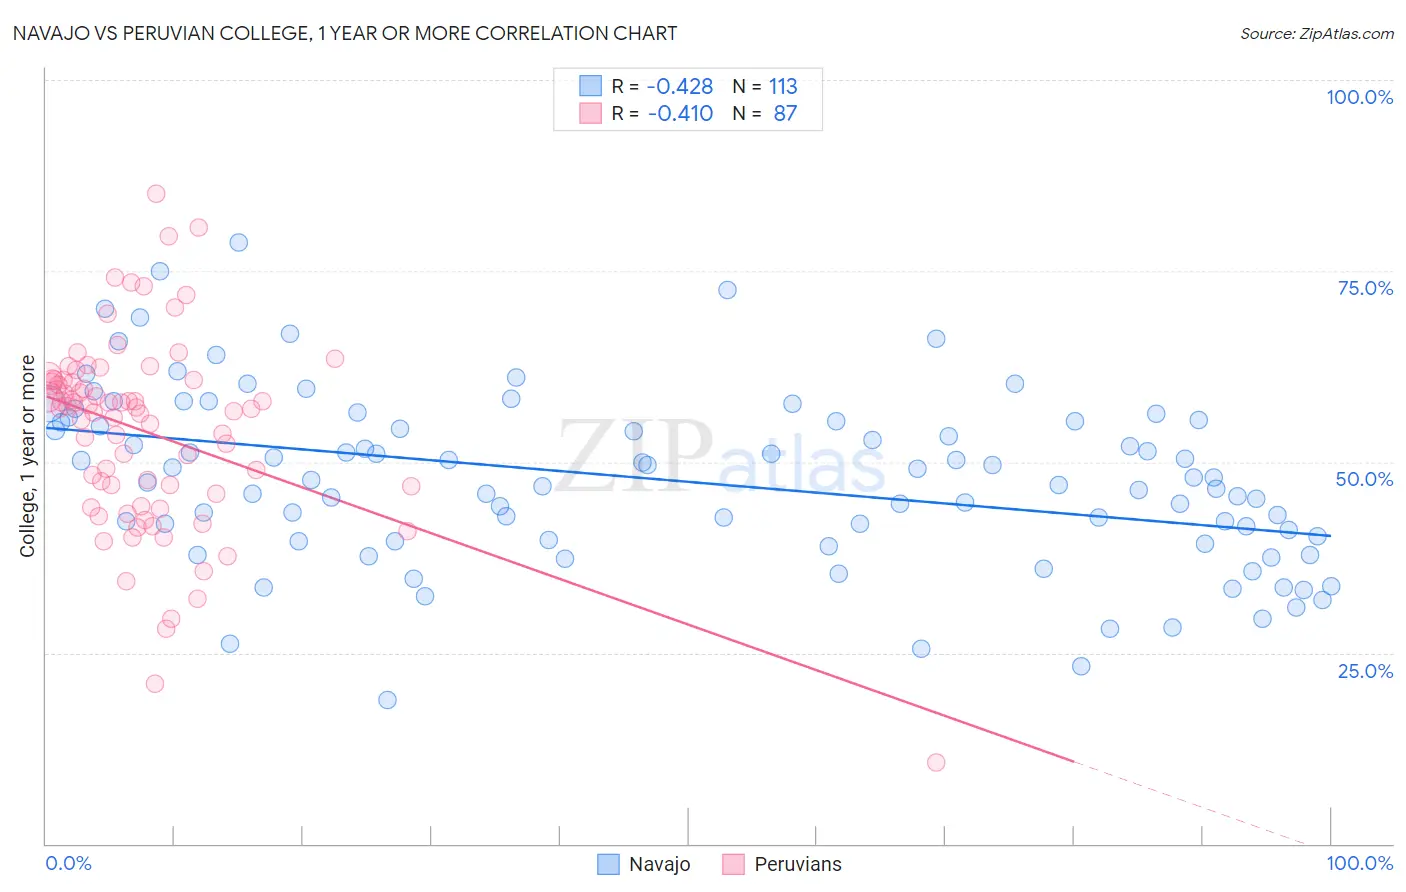
Navajo vs Peruvian College, 1 year or more Correlation Chart
The statistical analysis conducted on geographies consisting of 224,872,239 people shows a moderate negative correlation between the proportion of Navajo and percentage of population with at least college, 1 year or more education in the United States with a correlation coefficient (R) of -0.428 and weighted average of 50.8%. Similarly, the statistical analysis conducted on geographies consisting of 363,249,143 people shows a moderate negative correlation between the proportion of Peruvians and percentage of population with at least college, 1 year or more education in the United States with a correlation coefficient (R) of -0.410 and weighted average of 58.6%, a difference of 15.4%.
College, 1 year or more Correlation Summary
| Measurement | Navajo | Peruvian |
| Minimum | 18.9% | 10.6% |
| Maximum | 78.7% | 85.1% |
| Range | 59.8% | 74.5% |
| Mean | 47.6% | 53.9% |
| Median | 47.7% | 57.1% |
| Interquartile 25% (IQ1) | 39.7% | 45.8% |
| Interquartile 75% (IQ3) | 55.3% | 60.7% |
| Interquartile Range (IQR) | 15.6% | 14.9% |
| Standard Deviation (Sample) | 11.4% | 12.7% |
| Standard Deviation (Population) | 11.3% | 12.6% |
Similar Demographics by College, 1 year or more
Demographics Similar to Navajo by College, 1 year or more
In terms of college, 1 year or more, the demographic groups most similar to Navajo are Hopi (50.9%, a difference of 0.18%), Immigrants from Guatemala (50.7%, a difference of 0.23%), Immigrants from Cuba (50.7%, a difference of 0.24%), Immigrants from Latin America (50.7%, a difference of 0.27%), and Kiowa (51.0%, a difference of 0.31%).
| Demographics | Rating | Rank | College, 1 year or more |
| Guatemalans | 0.0 /100 | #315 | Tragic 51.2% |
| Cajuns | 0.0 /100 | #316 | Tragic 51.2% |
| Hispanics or Latinos | 0.0 /100 | #317 | Tragic 51.1% |
| Immigrants | Honduras | 0.0 /100 | #318 | Tragic 51.0% |
| Immigrants | El Salvador | 0.0 /100 | #319 | Tragic 51.0% |
| Kiowa | 0.0 /100 | #320 | Tragic 51.0% |
| Hopi | 0.0 /100 | #321 | Tragic 50.9% |
| Navajo | 0.0 /100 | #322 | Tragic 50.8% |
| Immigrants | Guatemala | 0.0 /100 | #323 | Tragic 50.7% |
| Immigrants | Cuba | 0.0 /100 | #324 | Tragic 50.7% |
| Immigrants | Latin America | 0.0 /100 | #325 | Tragic 50.7% |
| Dominicans | 0.0 /100 | #326 | Tragic 50.6% |
| Menominee | 0.0 /100 | #327 | Tragic 50.6% |
| Dutch West Indians | 0.0 /100 | #328 | Tragic 50.5% |
| Cape Verdeans | 0.0 /100 | #329 | Tragic 50.3% |
Demographics Similar to Peruvians by College, 1 year or more
In terms of college, 1 year or more, the demographic groups most similar to Peruvians are Colombian (58.7%, a difference of 0.010%), Costa Rican (58.6%, a difference of 0.070%), Dutch (58.6%, a difference of 0.090%), Guamanian/Chamorro (58.6%, a difference of 0.090%), and Immigrants from Thailand (58.6%, a difference of 0.10%).
| Demographics | Rating | Rank | College, 1 year or more |
| Scotch-Irish | 34.7 /100 | #186 | Fair 58.9% |
| Germans | 34.7 /100 | #187 | Fair 58.9% |
| French | 34.4 /100 | #188 | Fair 58.9% |
| Uruguayans | 31.8 /100 | #189 | Fair 58.8% |
| Immigrants | Cameroon | 31.2 /100 | #190 | Fair 58.8% |
| Immigrants | Philippines | 29.2 /100 | #191 | Fair 58.7% |
| Colombians | 27.6 /100 | #192 | Fair 58.7% |
| Peruvians | 27.5 /100 | #193 | Fair 58.6% |
| Costa Ricans | 26.4 /100 | #194 | Fair 58.6% |
| Dutch | 26.2 /100 | #195 | Fair 58.6% |
| Guamanians/Chamorros | 26.2 /100 | #196 | Fair 58.6% |
| Immigrants | Thailand | 26.0 /100 | #197 | Fair 58.6% |
| Immigrants | South Eastern Asia | 25.1 /100 | #198 | Fair 58.5% |
| Slovaks | 24.6 /100 | #199 | Fair 58.5% |
| Spanish | 24.2 /100 | #200 | Fair 58.5% |