Nicaraguan vs Immigrants from Hong Kong College, 1 year or more
COMPARE
Nicaraguan
Immigrants from Hong Kong
College, 1 year or more
College, 1 year or more Comparison
Nicaraguans
Immigrants from Hong Kong
53.9%
COLLEGE, 1 YEAR OR MORE
0.1/ 100
METRIC RATING
283rd/ 347
METRIC RANK
66.4%
COLLEGE, 1 YEAR OR MORE
100.0/ 100
METRIC RATING
21st/ 347
METRIC RANK
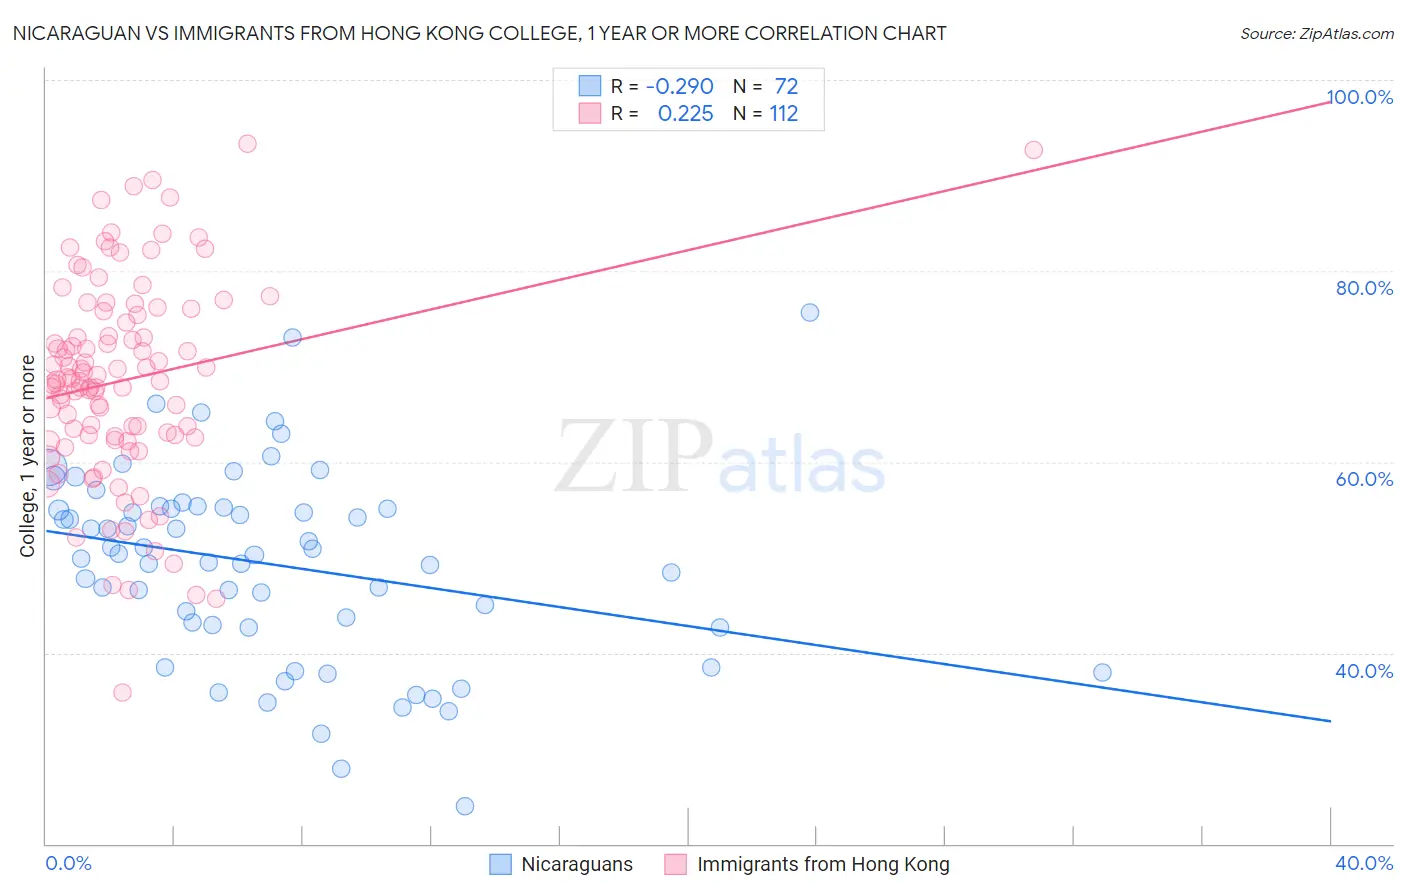
Nicaraguan vs Immigrants from Hong Kong College, 1 year or more Correlation Chart
The statistical analysis conducted on geographies consisting of 285,711,182 people shows a weak negative correlation between the proportion of Nicaraguans and percentage of population with at least college, 1 year or more education in the United States with a correlation coefficient (R) of -0.290 and weighted average of 53.9%. Similarly, the statistical analysis conducted on geographies consisting of 253,990,250 people shows a weak positive correlation between the proportion of Immigrants from Hong Kong and percentage of population with at least college, 1 year or more education in the United States with a correlation coefficient (R) of 0.225 and weighted average of 66.4%, a difference of 23.3%.
College, 1 year or more Correlation Summary
| Measurement | Nicaraguan | Immigrants from Hong Kong |
| Minimum | 24.0% | 35.8% |
| Maximum | 75.6% | 93.3% |
| Range | 51.6% | 57.4% |
| Mean | 49.3% | 68.5% |
| Median | 50.3% | 68.6% |
| Interquartile 25% (IQ1) | 42.8% | 62.6% |
| Interquartile 75% (IQ3) | 55.1% | 75.5% |
| Interquartile Range (IQR) | 12.3% | 12.9% |
| Standard Deviation (Sample) | 10.1% | 10.6% |
| Standard Deviation (Population) | 10.1% | 10.6% |
Similar Demographics by College, 1 year or more
Demographics Similar to Nicaraguans by College, 1 year or more
In terms of college, 1 year or more, the demographic groups most similar to Nicaraguans are Ute (53.8%, a difference of 0.17%), Guyanese (54.1%, a difference of 0.36%), Colville (54.1%, a difference of 0.40%), Cheyenne (54.1%, a difference of 0.42%), and Arapaho (54.1%, a difference of 0.47%).
| Demographics | Rating | Rank | College, 1 year or more |
| Shoshone | 0.2 /100 | #276 | Tragic 54.3% |
| Ecuadorians | 0.2 /100 | #277 | Tragic 54.3% |
| Immigrants | Jamaica | 0.1 /100 | #278 | Tragic 54.2% |
| Arapaho | 0.1 /100 | #279 | Tragic 54.1% |
| Cheyenne | 0.1 /100 | #280 | Tragic 54.1% |
| Colville | 0.1 /100 | #281 | Tragic 54.1% |
| Guyanese | 0.1 /100 | #282 | Tragic 54.1% |
| Nicaraguans | 0.1 /100 | #283 | Tragic 53.9% |
| Ute | 0.1 /100 | #284 | Tragic 53.8% |
| Immigrants | Guyana | 0.1 /100 | #285 | Tragic 53.5% |
| Central American Indians | 0.1 /100 | #286 | Tragic 53.5% |
| Immigrants | Belize | 0.1 /100 | #287 | Tragic 53.5% |
| Alaska Natives | 0.0 /100 | #288 | Tragic 53.4% |
| Immigrants | Ecuador | 0.0 /100 | #289 | Tragic 53.4% |
| Alaskan Athabascans | 0.0 /100 | #290 | Tragic 53.4% |
Demographics Similar to Immigrants from Hong Kong by College, 1 year or more
In terms of college, 1 year or more, the demographic groups most similar to Immigrants from Hong Kong are Soviet Union (66.4%, a difference of 0.060%), Immigrants from Korea (66.5%, a difference of 0.070%), Immigrants from Switzerland (66.5%, a difference of 0.11%), Immigrants from China (66.4%, a difference of 0.12%), and Eastern European (66.6%, a difference of 0.16%).
| Demographics | Rating | Rank | College, 1 year or more |
| Burmese | 100.0 /100 | #14 | Exceptional 66.7% |
| Cambodians | 100.0 /100 | #15 | Exceptional 66.7% |
| Immigrants | Japan | 100.0 /100 | #16 | Exceptional 66.7% |
| Immigrants | Eastern Asia | 100.0 /100 | #17 | Exceptional 66.6% |
| Eastern Europeans | 100.0 /100 | #18 | Exceptional 66.6% |
| Immigrants | Switzerland | 100.0 /100 | #19 | Exceptional 66.5% |
| Immigrants | Korea | 100.0 /100 | #20 | Exceptional 66.5% |
| Immigrants | Hong Kong | 100.0 /100 | #21 | Exceptional 66.4% |
| Soviet Union | 100.0 /100 | #22 | Exceptional 66.4% |
| Immigrants | China | 100.0 /100 | #23 | Exceptional 66.4% |
| Immigrants | Belgium | 100.0 /100 | #24 | Exceptional 66.3% |
| Indians (Asian) | 100.0 /100 | #25 | Exceptional 66.1% |
| Latvians | 100.0 /100 | #26 | Exceptional 66.1% |
| Immigrants | Ireland | 100.0 /100 | #27 | Exceptional 65.9% |
| Immigrants | France | 100.0 /100 | #28 | Exceptional 65.8% |