Navajo vs Immigrants from Uzbekistan College, 1 year or more
COMPARE
Navajo
Immigrants from Uzbekistan
College, 1 year or more
College, 1 year or more Comparison
Navajo
Immigrants from Uzbekistan
50.8%
COLLEGE, 1 YEAR OR MORE
0.0/ 100
METRIC RATING
322nd/ 347
METRIC RANK
61.0%
COLLEGE, 1 YEAR OR MORE
88.0/ 100
METRIC RATING
133rd/ 347
METRIC RANK
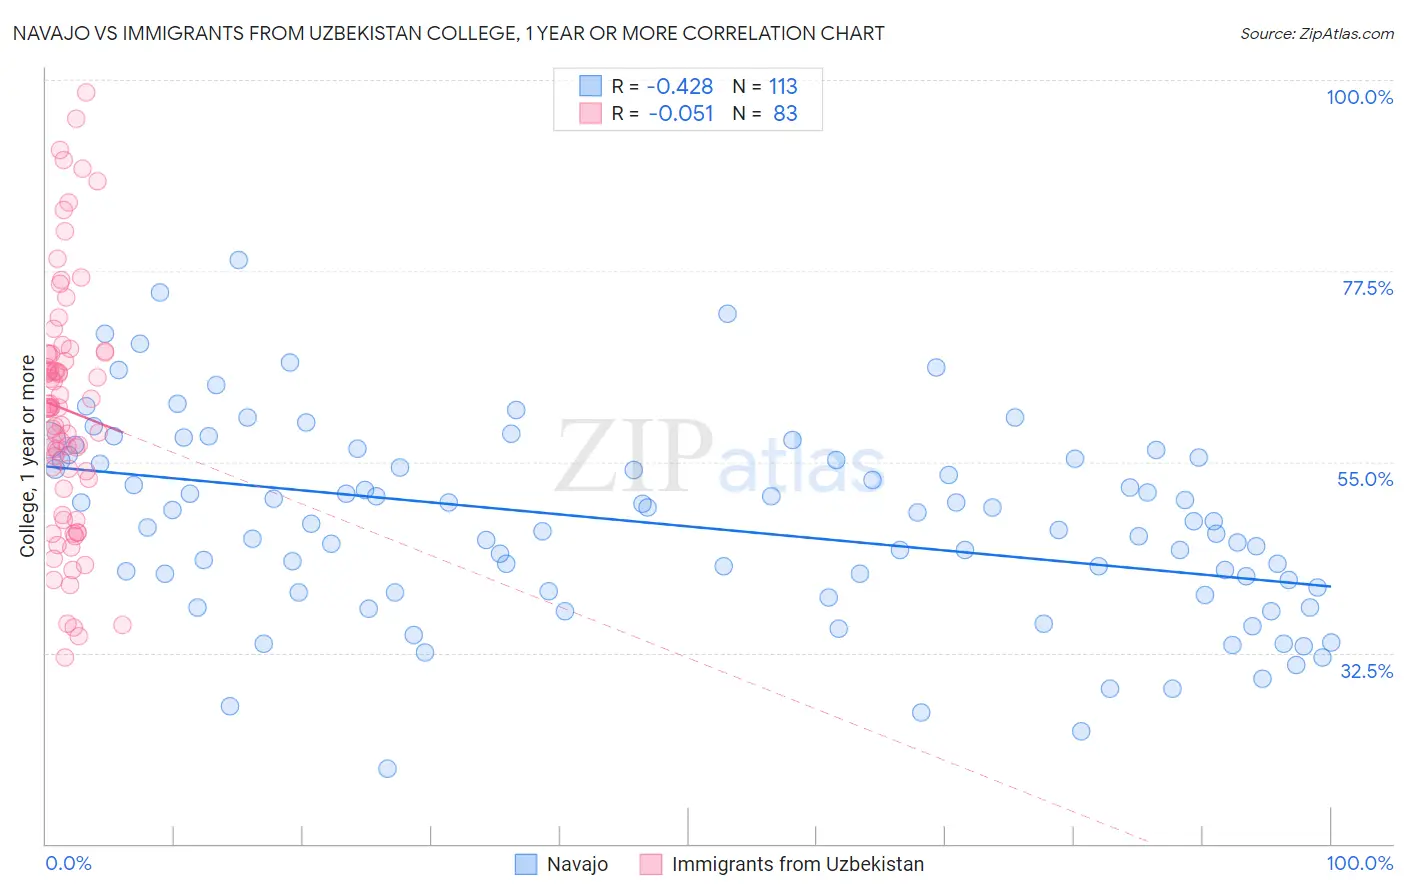
Navajo vs Immigrants from Uzbekistan College, 1 year or more Correlation Chart
The statistical analysis conducted on geographies consisting of 224,872,239 people shows a moderate negative correlation between the proportion of Navajo and percentage of population with at least college, 1 year or more education in the United States with a correlation coefficient (R) of -0.428 and weighted average of 50.8%. Similarly, the statistical analysis conducted on geographies consisting of 118,765,305 people shows a slight negative correlation between the proportion of Immigrants from Uzbekistan and percentage of population with at least college, 1 year or more education in the United States with a correlation coefficient (R) of -0.051 and weighted average of 61.0%, a difference of 20.0%.
College, 1 year or more Correlation Summary
| Measurement | Navajo | Immigrants from Uzbekistan |
| Minimum | 18.9% | 31.9% |
| Maximum | 78.7% | 98.6% |
| Range | 59.8% | 66.7% |
| Mean | 47.6% | 61.1% |
| Median | 47.7% | 61.4% |
| Interquartile 25% (IQ1) | 39.7% | 51.9% |
| Interquartile 75% (IQ3) | 55.3% | 67.8% |
| Interquartile Range (IQR) | 15.6% | 15.9% |
| Standard Deviation (Sample) | 11.4% | 14.6% |
| Standard Deviation (Population) | 11.3% | 14.5% |
Similar Demographics by College, 1 year or more
Demographics Similar to Navajo by College, 1 year or more
In terms of college, 1 year or more, the demographic groups most similar to Navajo are Hopi (50.9%, a difference of 0.18%), Immigrants from Guatemala (50.7%, a difference of 0.23%), Immigrants from Cuba (50.7%, a difference of 0.24%), Immigrants from Latin America (50.7%, a difference of 0.27%), and Kiowa (51.0%, a difference of 0.31%).
| Demographics | Rating | Rank | College, 1 year or more |
| Guatemalans | 0.0 /100 | #315 | Tragic 51.2% |
| Cajuns | 0.0 /100 | #316 | Tragic 51.2% |
| Hispanics or Latinos | 0.0 /100 | #317 | Tragic 51.1% |
| Immigrants | Honduras | 0.0 /100 | #318 | Tragic 51.0% |
| Immigrants | El Salvador | 0.0 /100 | #319 | Tragic 51.0% |
| Kiowa | 0.0 /100 | #320 | Tragic 51.0% |
| Hopi | 0.0 /100 | #321 | Tragic 50.9% |
| Navajo | 0.0 /100 | #322 | Tragic 50.8% |
| Immigrants | Guatemala | 0.0 /100 | #323 | Tragic 50.7% |
| Immigrants | Cuba | 0.0 /100 | #324 | Tragic 50.7% |
| Immigrants | Latin America | 0.0 /100 | #325 | Tragic 50.7% |
| Dominicans | 0.0 /100 | #326 | Tragic 50.6% |
| Menominee | 0.0 /100 | #327 | Tragic 50.6% |
| Dutch West Indians | 0.0 /100 | #328 | Tragic 50.5% |
| Cape Verdeans | 0.0 /100 | #329 | Tragic 50.3% |
Demographics Similar to Immigrants from Uzbekistan by College, 1 year or more
In terms of college, 1 year or more, the demographic groups most similar to Immigrants from Uzbekistan are Immigrants from Venezuela (61.0%, a difference of 0.010%), Scandinavian (61.0%, a difference of 0.030%), Immigrants from Uganda (60.9%, a difference of 0.070%), Basque (60.9%, a difference of 0.090%), and Slovene (60.9%, a difference of 0.18%).
| Demographics | Rating | Rank | College, 1 year or more |
| Alsatians | 91.3 /100 | #126 | Exceptional 61.3% |
| Immigrants | Eastern Africa | 91.1 /100 | #127 | Exceptional 61.2% |
| Immigrants | Italy | 91.1 /100 | #128 | Exceptional 61.2% |
| Ugandans | 90.7 /100 | #129 | Exceptional 61.2% |
| Italians | 89.5 /100 | #130 | Excellent 61.1% |
| Immigrants | Morocco | 89.5 /100 | #131 | Excellent 61.1% |
| Scandinavians | 88.2 /100 | #132 | Excellent 61.0% |
| Immigrants | Uzbekistan | 88.0 /100 | #133 | Excellent 61.0% |
| Immigrants | Venezuela | 87.9 /100 | #134 | Excellent 61.0% |
| Immigrants | Uganda | 87.4 /100 | #135 | Excellent 60.9% |
| Basques | 87.2 /100 | #136 | Excellent 60.9% |
| Slovenes | 86.5 /100 | #137 | Excellent 60.9% |
| Taiwanese | 84.3 /100 | #138 | Excellent 60.7% |
| Immigrants | Eritrea | 84.3 /100 | #139 | Excellent 60.7% |
| Iraqis | 83.3 /100 | #140 | Excellent 60.7% |