Navajo vs Immigrants from Hong Kong 9th Grade
COMPARE
Navajo
Immigrants from Hong Kong
9th Grade
9th Grade Comparison
Navajo
Immigrants from Hong Kong
93.9%
9TH GRADE
0.3/ 100
METRIC RATING
266th/ 347
METRIC RANK
94.1%
9TH GRADE
1.3/ 100
METRIC RATING
250th/ 347
METRIC RANK
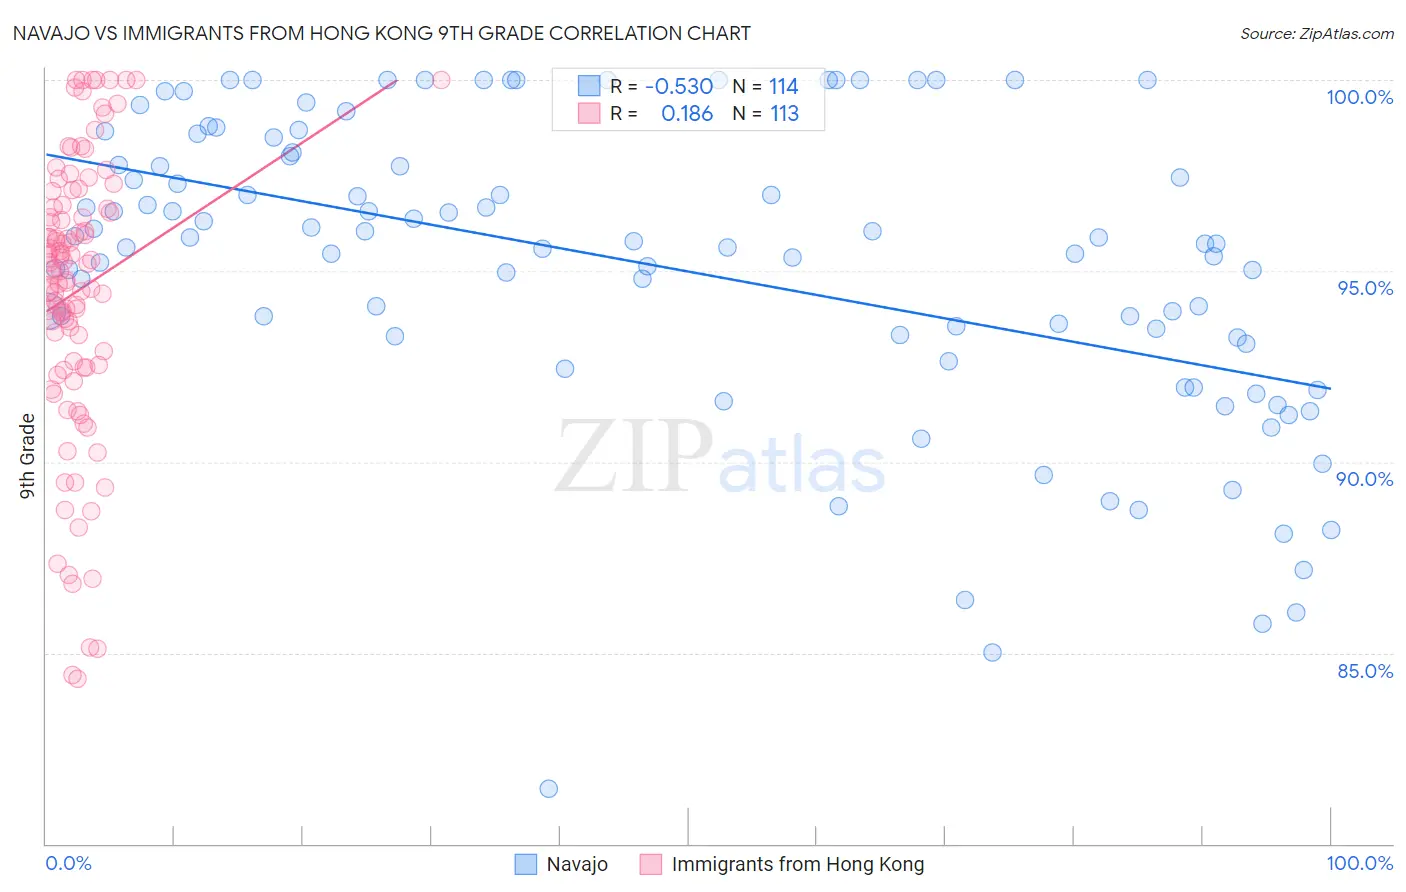
Navajo vs Immigrants from Hong Kong 9th Grade Correlation Chart
The statistical analysis conducted on geographies consisting of 224,872,587 people shows a substantial negative correlation between the proportion of Navajo and percentage of population with at least 9th grade education in the United States with a correlation coefficient (R) of -0.530 and weighted average of 93.9%. Similarly, the statistical analysis conducted on geographies consisting of 253,990,382 people shows a poor positive correlation between the proportion of Immigrants from Hong Kong and percentage of population with at least 9th grade education in the United States with a correlation coefficient (R) of 0.186 and weighted average of 94.1%, a difference of 0.25%.
9th Grade Correlation Summary
| Measurement | Navajo | Immigrants from Hong Kong |
| Minimum | 81.4% | 84.3% |
| Maximum | 100.0% | 100.0% |
| Range | 18.6% | 15.7% |
| Mean | 95.1% | 94.5% |
| Median | 95.7% | 95.0% |
| Interquartile 25% (IQ1) | 93.2% | 92.5% |
| Interquartile 75% (IQ3) | 98.0% | 96.7% |
| Interquartile Range (IQR) | 4.8% | 4.2% |
| Standard Deviation (Sample) | 3.9% | 3.7% |
| Standard Deviation (Population) | 3.9% | 3.7% |
Demographics Similar to Navajo and Immigrants from Hong Kong by 9th Grade
In terms of 9th grade, the demographic groups most similar to Navajo are Immigrants from Congo (93.9%, a difference of 0.010%), Native/Alaskan (93.9%, a difference of 0.010%), Immigrants from Jamaica (93.9%, a difference of 0.020%), Immigrants from Uzbekistan (93.9%, a difference of 0.020%), and Armenian (93.9%, a difference of 0.020%). Similarly, the demographic groups most similar to Immigrants from Hong Kong are Uruguayan (94.1%, a difference of 0.0%), Immigrants from Somalia (94.1%, a difference of 0.010%), Jamaican (94.1%, a difference of 0.060%), Immigrants from Senegal (94.1%, a difference of 0.060%), and Colombian (94.0%, a difference of 0.080%).
| Demographics | Rating | Rank | 9th Grade |
| Immigrants | Somalia | 1.4 /100 | #248 | Tragic 94.1% |
| Uruguayans | 1.3 /100 | #249 | Tragic 94.1% |
| Immigrants | Hong Kong | 1.3 /100 | #250 | Tragic 94.1% |
| Jamaicans | 1.0 /100 | #251 | Tragic 94.1% |
| Immigrants | Senegal | 0.9 /100 | #252 | Tragic 94.1% |
| Colombians | 0.8 /100 | #253 | Tragic 94.0% |
| U.S. Virgin Islanders | 0.7 /100 | #254 | Tragic 94.0% |
| Immigrants | Nigeria | 0.6 /100 | #255 | Tragic 94.0% |
| Immigrants | Afghanistan | 0.5 /100 | #256 | Tragic 94.0% |
| Immigrants | Costa Rica | 0.5 /100 | #257 | Tragic 94.0% |
| Immigrants | Thailand | 0.5 /100 | #258 | Tragic 93.9% |
| Ghanaians | 0.5 /100 | #259 | Tragic 93.9% |
| Pima | 0.4 /100 | #260 | Tragic 93.9% |
| South Americans | 0.4 /100 | #261 | Tragic 93.9% |
| Immigrants | Jamaica | 0.4 /100 | #262 | Tragic 93.9% |
| Immigrants | Uzbekistan | 0.4 /100 | #263 | Tragic 93.9% |
| Immigrants | Congo | 0.4 /100 | #264 | Tragic 93.9% |
| Natives/Alaskans | 0.4 /100 | #265 | Tragic 93.9% |
| Navajo | 0.3 /100 | #266 | Tragic 93.9% |
| Armenians | 0.3 /100 | #267 | Tragic 93.9% |
| Immigrants | Bolivia | 0.3 /100 | #268 | Tragic 93.9% |