Navajo vs Immigrants from Hong Kong Average Family Size
COMPARE
Navajo
Immigrants from Hong Kong
Average Family Size
Average Family Size Comparison
Navajo
Immigrants from Hong Kong
3.65
AVERAGE FAMILY SIZE
100.0/ 100
METRIC RATING
5th/ 347
METRIC RANK
3.26
AVERAGE FAMILY SIZE
88.6/ 100
METRIC RATING
129th/ 347
METRIC RANK
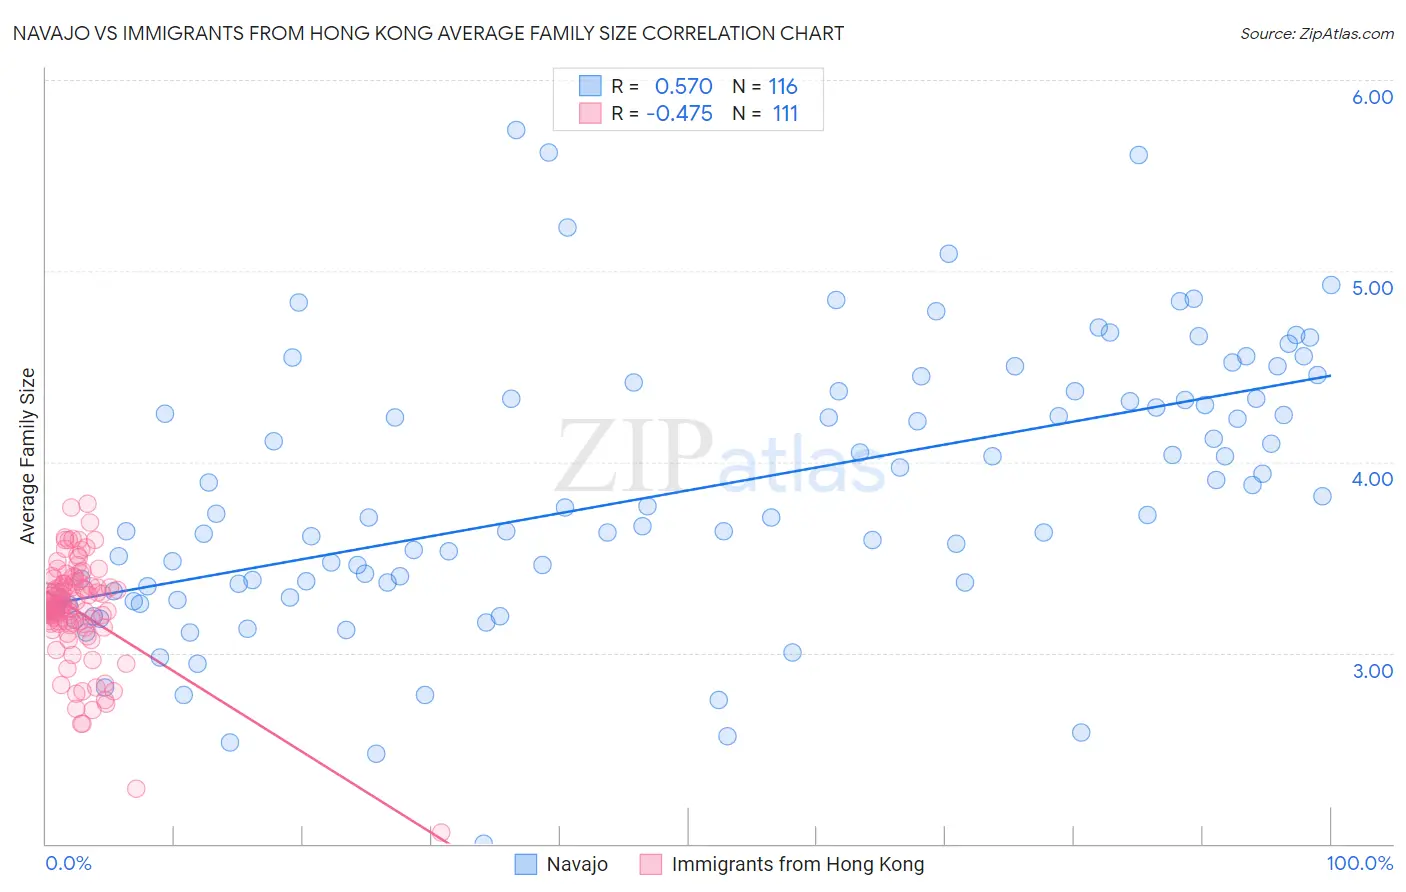
Navajo vs Immigrants from Hong Kong Average Family Size Correlation Chart
The statistical analysis conducted on geographies consisting of 224,751,330 people shows a substantial positive correlation between the proportion of Navajo and average family size in the United States with a correlation coefficient (R) of 0.570 and weighted average of 3.65. Similarly, the statistical analysis conducted on geographies consisting of 253,898,465 people shows a moderate negative correlation between the proportion of Immigrants from Hong Kong and average family size in the United States with a correlation coefficient (R) of -0.475 and weighted average of 3.26, a difference of 11.9%.
Average Family Size Correlation Summary
| Measurement | Navajo | Immigrants from Hong Kong |
| Minimum | 2.00 | 2.06 |
| Maximum | 5.74 | 3.78 |
| Range | 3.74 | 1.72 |
| Mean | 3.83 | 3.22 |
| Median | 3.71 | 3.24 |
| Interquartile 25% (IQ1) | 3.31 | 3.15 |
| Interquartile 75% (IQ3) | 4.33 | 3.36 |
| Interquartile Range (IQR) | 1.03 | 0.21 |
| Standard Deviation (Sample) | 0.71 | 0.27 |
| Standard Deviation (Population) | 0.71 | 0.27 |
Similar Demographics by Average Family Size
Demographics Similar to Navajo by Average Family Size
In terms of average family size, the demographic groups most similar to Navajo are Arapaho (3.64, a difference of 0.27%), Inupiat (3.63, a difference of 0.48%), Immigrants from Yemen (3.60, a difference of 1.3%), Hopi (3.60, a difference of 1.4%), and Spanish American Indian (3.58, a difference of 1.7%).
| Demographics | Rating | Rank | Average Family Size |
| Yup'ik | 100 /100 | #1 | Exceptional 4.00 |
| Crow | 100 /100 | #2 | Exceptional 3.82 |
| Pueblo | 100 /100 | #3 | Exceptional 3.79 |
| Pima | 100 /100 | #4 | Exceptional 3.75 |
| Navajo | 100.0 /100 | #5 | Exceptional 3.65 |
| Arapaho | 100.0 /100 | #6 | Exceptional 3.64 |
| Inupiat | 100.0 /100 | #7 | Exceptional 3.63 |
| Immigrants | Yemen | 100.0 /100 | #8 | Exceptional 3.60 |
| Hopi | 100.0 /100 | #9 | Exceptional 3.60 |
| Spanish American Indians | 100.0 /100 | #10 | Exceptional 3.58 |
| Tohono O'odham | 100.0 /100 | #11 | Exceptional 3.53 |
| Immigrants | Mexico | 100.0 /100 | #12 | Exceptional 3.52 |
| Sioux | 100.0 /100 | #13 | Exceptional 3.52 |
| Immigrants | Central America | 100.0 /100 | #14 | Exceptional 3.49 |
| Tongans | 100.0 /100 | #15 | Exceptional 3.49 |
Demographics Similar to Immigrants from Hong Kong by Average Family Size
In terms of average family size, the demographic groups most similar to Immigrants from Hong Kong are Laotian (3.26, a difference of 0.010%), Immigrants from Western Asia (3.26, a difference of 0.040%), Colombian (3.26, a difference of 0.060%), Costa Rican (3.26, a difference of 0.080%), and Immigrants from Costa Rica (3.26, a difference of 0.10%).
| Demographics | Rating | Rank | Average Family Size |
| Immigrants | Colombia | 92.8 /100 | #122 | Exceptional 3.27 |
| Alaskan Athabascans | 92.4 /100 | #123 | Exceptional 3.27 |
| South American Indians | 91.6 /100 | #124 | Exceptional 3.26 |
| Immigrants | Cuba | 91.3 /100 | #125 | Exceptional 3.26 |
| Immigrants | Costa Rica | 90.7 /100 | #126 | Exceptional 3.26 |
| Immigrants | Syria | 90.6 /100 | #127 | Exceptional 3.26 |
| Colombians | 89.9 /100 | #128 | Excellent 3.26 |
| Immigrants | Hong Kong | 88.6 /100 | #129 | Excellent 3.26 |
| Laotians | 88.5 /100 | #130 | Excellent 3.26 |
| Immigrants | Western Asia | 87.7 /100 | #131 | Excellent 3.26 |
| Costa Ricans | 86.8 /100 | #132 | Excellent 3.26 |
| Immigrants | Venezuela | 86.3 /100 | #133 | Excellent 3.26 |
| Africans | 84.9 /100 | #134 | Excellent 3.25 |
| Panamanians | 84.2 /100 | #135 | Excellent 3.25 |
| Comanche | 82.8 /100 | #136 | Excellent 3.25 |