Immigrants from Bahamas vs Immigrants from Hong Kong College, 1 year or more
COMPARE
Immigrants from Bahamas
Immigrants from Hong Kong
College, 1 year or more
College, 1 year or more Comparison
Immigrants from Bahamas
Immigrants from Hong Kong
55.2%
COLLEGE, 1 YEAR OR MORE
0.5/ 100
METRIC RATING
255th/ 347
METRIC RANK
66.4%
COLLEGE, 1 YEAR OR MORE
100.0/ 100
METRIC RATING
21st/ 347
METRIC RANK
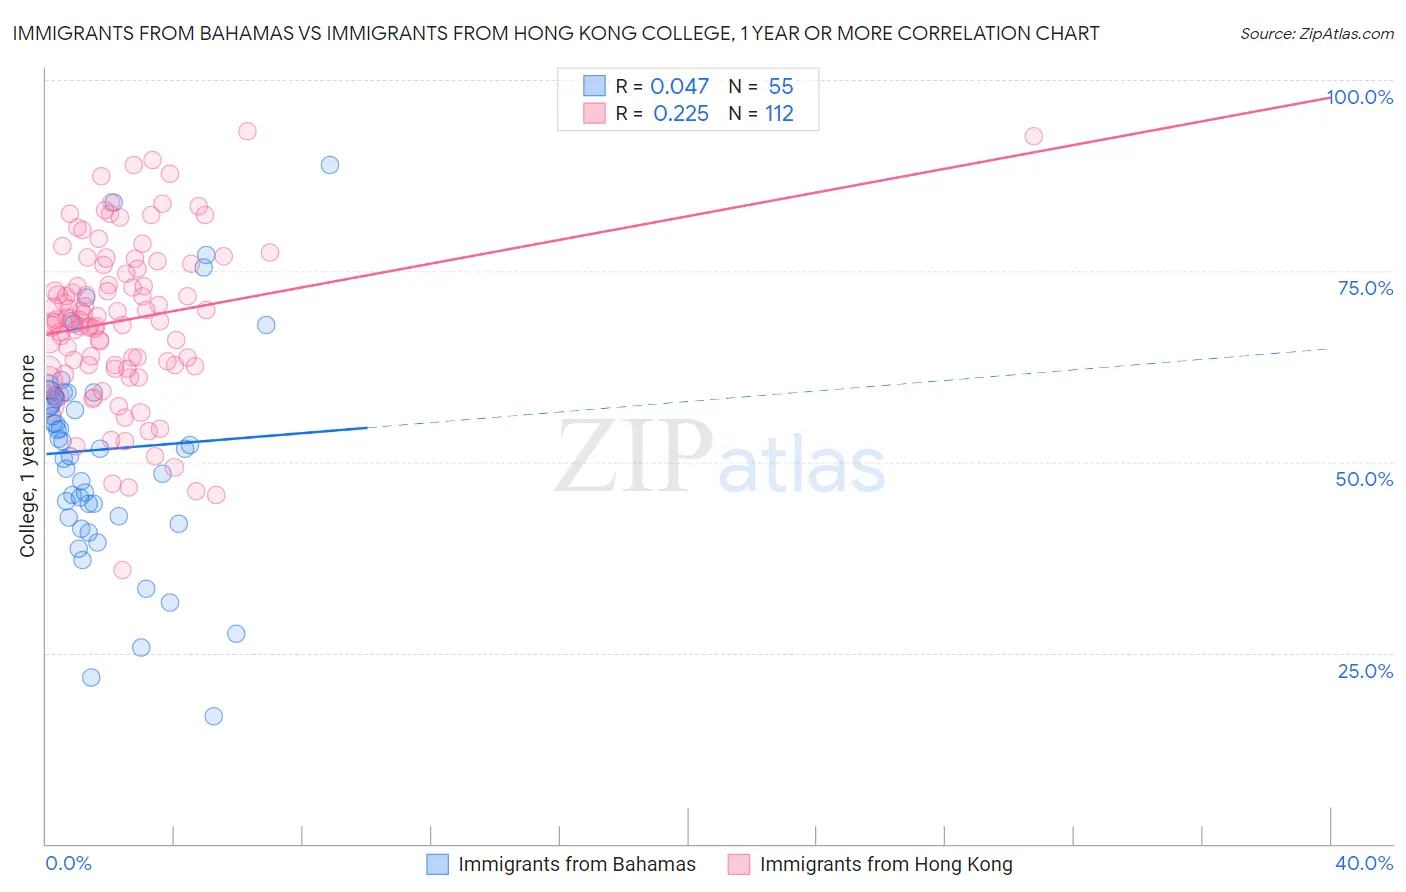
Immigrants from Bahamas vs Immigrants from Hong Kong College, 1 year or more Correlation Chart
The statistical analysis conducted on geographies consisting of 104,668,341 people shows no correlation between the proportion of Immigrants from Bahamas and percentage of population with at least college, 1 year or more education in the United States with a correlation coefficient (R) of 0.047 and weighted average of 55.2%. Similarly, the statistical analysis conducted on geographies consisting of 253,990,250 people shows a weak positive correlation between the proportion of Immigrants from Hong Kong and percentage of population with at least college, 1 year or more education in the United States with a correlation coefficient (R) of 0.225 and weighted average of 66.4%, a difference of 20.4%.
College, 1 year or more Correlation Summary
| Measurement | Immigrants from Bahamas | Immigrants from Hong Kong |
| Minimum | 16.6% | 35.8% |
| Maximum | 88.9% | 93.3% |
| Range | 72.2% | 57.4% |
| Mean | 51.6% | 68.5% |
| Median | 52.3% | 68.6% |
| Interquartile 25% (IQ1) | 42.8% | 62.6% |
| Interquartile 75% (IQ3) | 59.0% | 75.5% |
| Interquartile Range (IQR) | 16.2% | 12.9% |
| Standard Deviation (Sample) | 14.2% | 10.6% |
| Standard Deviation (Population) | 14.1% | 10.6% |
Similar Demographics by College, 1 year or more
Demographics Similar to Immigrants from Bahamas by College, 1 year or more
In terms of college, 1 year or more, the demographic groups most similar to Immigrants from Bahamas are Japanese (55.2%, a difference of 0.050%), Immigrants from West Indies (55.2%, a difference of 0.080%), Indonesian (55.1%, a difference of 0.17%), Immigrants from Barbados (55.4%, a difference of 0.30%), and Aleut (55.4%, a difference of 0.40%).
| Demographics | Rating | Rank | College, 1 year or more |
| Immigrants | Congo | 0.8 /100 | #248 | Tragic 55.6% |
| Immigrants | Trinidad and Tobago | 0.7 /100 | #249 | Tragic 55.5% |
| Delaware | 0.7 /100 | #250 | Tragic 55.5% |
| Immigrants | Cambodia | 0.6 /100 | #251 | Tragic 55.4% |
| Aleuts | 0.6 /100 | #252 | Tragic 55.4% |
| Immigrants | Barbados | 0.6 /100 | #253 | Tragic 55.4% |
| Japanese | 0.5 /100 | #254 | Tragic 55.2% |
| Immigrants | Bahamas | 0.5 /100 | #255 | Tragic 55.2% |
| Immigrants | West Indies | 0.5 /100 | #256 | Tragic 55.2% |
| Indonesians | 0.4 /100 | #257 | Tragic 55.1% |
| Africans | 0.4 /100 | #258 | Tragic 55.0% |
| Nepalese | 0.3 /100 | #259 | Tragic 54.9% |
| Jamaicans | 0.3 /100 | #260 | Tragic 54.9% |
| Ottawa | 0.3 /100 | #261 | Tragic 54.9% |
| Immigrants | St. Vincent and the Grenadines | 0.3 /100 | #262 | Tragic 54.8% |
Demographics Similar to Immigrants from Hong Kong by College, 1 year or more
In terms of college, 1 year or more, the demographic groups most similar to Immigrants from Hong Kong are Soviet Union (66.4%, a difference of 0.060%), Immigrants from Korea (66.5%, a difference of 0.070%), Immigrants from Switzerland (66.5%, a difference of 0.11%), Immigrants from China (66.4%, a difference of 0.12%), and Eastern European (66.6%, a difference of 0.16%).
| Demographics | Rating | Rank | College, 1 year or more |
| Burmese | 100.0 /100 | #14 | Exceptional 66.7% |
| Cambodians | 100.0 /100 | #15 | Exceptional 66.7% |
| Immigrants | Japan | 100.0 /100 | #16 | Exceptional 66.7% |
| Immigrants | Eastern Asia | 100.0 /100 | #17 | Exceptional 66.6% |
| Eastern Europeans | 100.0 /100 | #18 | Exceptional 66.6% |
| Immigrants | Switzerland | 100.0 /100 | #19 | Exceptional 66.5% |
| Immigrants | Korea | 100.0 /100 | #20 | Exceptional 66.5% |
| Immigrants | Hong Kong | 100.0 /100 | #21 | Exceptional 66.4% |
| Soviet Union | 100.0 /100 | #22 | Exceptional 66.4% |
| Immigrants | China | 100.0 /100 | #23 | Exceptional 66.4% |
| Immigrants | Belgium | 100.0 /100 | #24 | Exceptional 66.3% |
| Indians (Asian) | 100.0 /100 | #25 | Exceptional 66.1% |
| Latvians | 100.0 /100 | #26 | Exceptional 66.1% |
| Immigrants | Ireland | 100.0 /100 | #27 | Exceptional 65.9% |
| Immigrants | France | 100.0 /100 | #28 | Exceptional 65.8% |