Mongolian vs Comanche 4th Grade
COMPARE
Mongolian
Comanche
4th Grade
4th Grade Comparison
Mongolians
Comanche
97.5%
4TH GRADE
34.7/ 100
METRIC RATING
187th/ 347
METRIC RANK
97.5%
4TH GRADE
45.3/ 100
METRIC RATING
178th/ 347
METRIC RANK
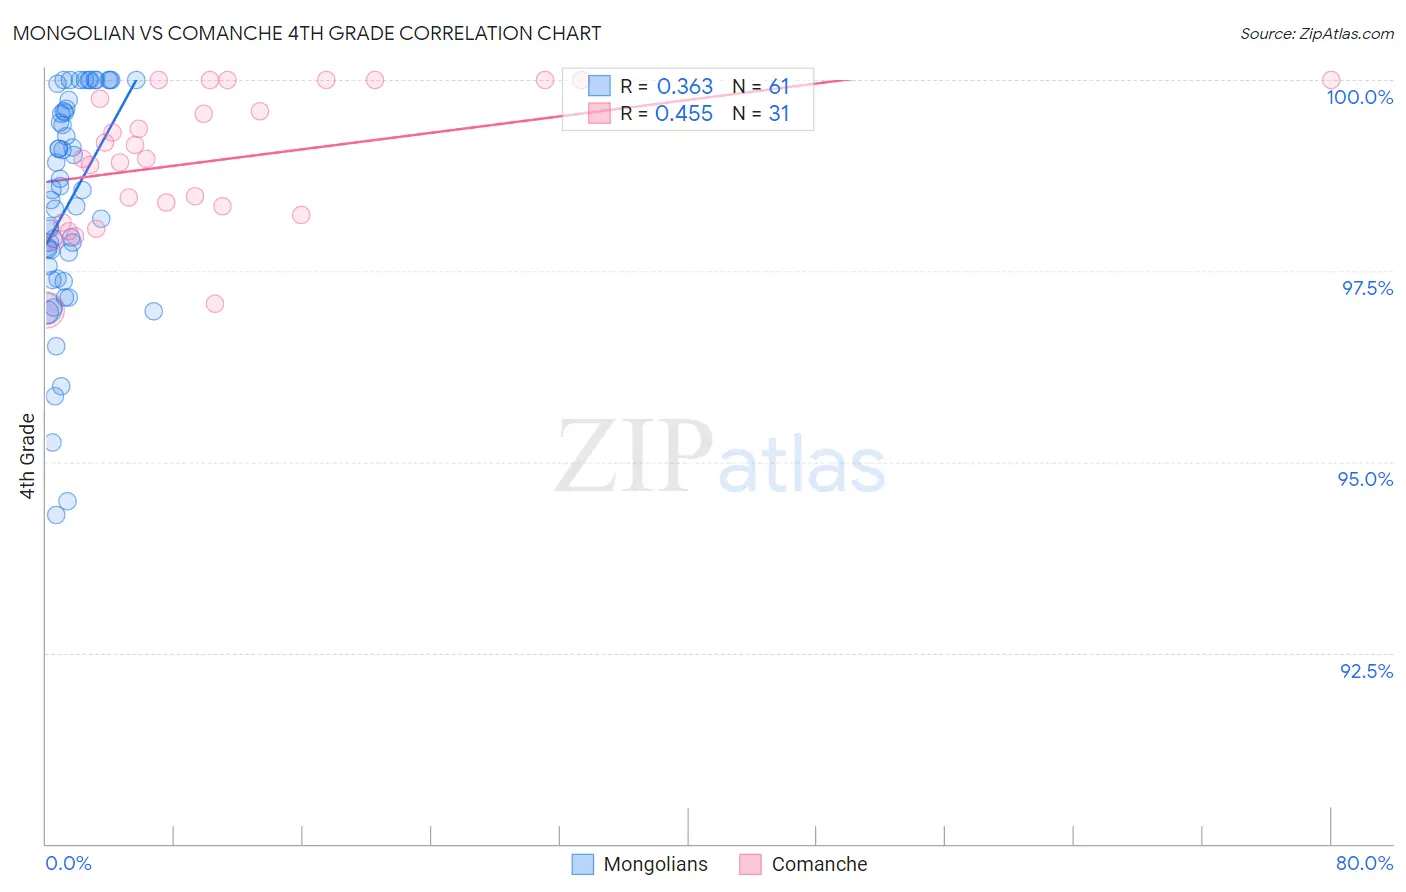
Mongolian vs Comanche 4th Grade Correlation Chart
The statistical analysis conducted on geographies consisting of 140,362,004 people shows a mild positive correlation between the proportion of Mongolians and percentage of population with at least 4th grade education in the United States with a correlation coefficient (R) of 0.363 and weighted average of 97.5%. Similarly, the statistical analysis conducted on geographies consisting of 109,786,530 people shows a moderate positive correlation between the proportion of Comanche and percentage of population with at least 4th grade education in the United States with a correlation coefficient (R) of 0.455 and weighted average of 97.5%, a difference of 0.040%.
4th Grade Correlation Summary
| Measurement | Mongolian | Comanche |
| Minimum | 94.3% | 97.0% |
| Maximum | 100.0% | 100.0% |
| Range | 5.7% | 3.0% |
| Mean | 98.4% | 99.0% |
| Median | 98.6% | 99.0% |
| Interquartile 25% (IQ1) | 97.5% | 98.2% |
| Interquartile 75% (IQ3) | 99.6% | 100.0% |
| Interquartile Range (IQR) | 2.1% | 1.8% |
| Standard Deviation (Sample) | 1.4% | 0.90% |
| Standard Deviation (Population) | 1.4% | 0.88% |
Demographics Similar to Mongolians and Comanche by 4th Grade
In terms of 4th grade, the demographic groups most similar to Mongolians are Immigrants from Kenya (97.5%, a difference of 0.0%), Dutch West Indian (97.5%, a difference of 0.0%), Immigrants from Argentina (97.5%, a difference of 0.0%), Pakistani (97.5%, a difference of 0.010%), and Panamanian (97.4%, a difference of 0.010%). Similarly, the demographic groups most similar to Comanche are Immigrants from Brazil (97.5%, a difference of 0.0%), Arab (97.5%, a difference of 0.010%), Immigrants from Kazakhstan (97.5%, a difference of 0.010%), Immigrants from Venezuela (97.5%, a difference of 0.010%), and Immigrants from Taiwan (97.5%, a difference of 0.010%).
| Demographics | Rating | Rank | 4th Grade |
| Immigrants | Sri Lanka | 51.1 /100 | #172 | Average 97.5% |
| Immigrants | Korea | 50.6 /100 | #173 | Average 97.5% |
| Egyptians | 50.0 /100 | #174 | Average 97.5% |
| Immigrants | Micronesia | 49.6 /100 | #175 | Average 97.5% |
| Arabs | 48.7 /100 | #176 | Average 97.5% |
| Immigrants | Brazil | 46.1 /100 | #177 | Average 97.5% |
| Comanche | 45.3 /100 | #178 | Average 97.5% |
| Immigrants | Kazakhstan | 43.6 /100 | #179 | Average 97.5% |
| Immigrants | Venezuela | 42.7 /100 | #180 | Average 97.5% |
| Immigrants | Taiwan | 41.5 /100 | #181 | Average 97.5% |
| Spanish Americans | 39.3 /100 | #182 | Fair 97.5% |
| Argentineans | 39.0 /100 | #183 | Fair 97.5% |
| Pakistanis | 36.2 /100 | #184 | Fair 97.5% |
| Immigrants | Kenya | 35.8 /100 | #185 | Fair 97.5% |
| Dutch West Indians | 35.8 /100 | #186 | Fair 97.5% |
| Mongolians | 34.7 /100 | #187 | Fair 97.5% |
| Immigrants | Argentina | 34.6 /100 | #188 | Fair 97.5% |
| Panamanians | 31.9 /100 | #189 | Fair 97.4% |
| Blacks/African Americans | 31.1 /100 | #190 | Fair 97.4% |
| Navajo | 30.7 /100 | #191 | Fair 97.4% |
| Immigrants | Ukraine | 30.1 /100 | #192 | Fair 97.4% |