Ute vs Comanche 4th Grade
COMPARE
Ute
Comanche
4th Grade
4th Grade Comparison
Ute
Comanche
97.7%
4TH GRADE
80.6/ 100
METRIC RATING
147th/ 347
METRIC RANK
97.5%
4TH GRADE
45.3/ 100
METRIC RATING
178th/ 347
METRIC RANK
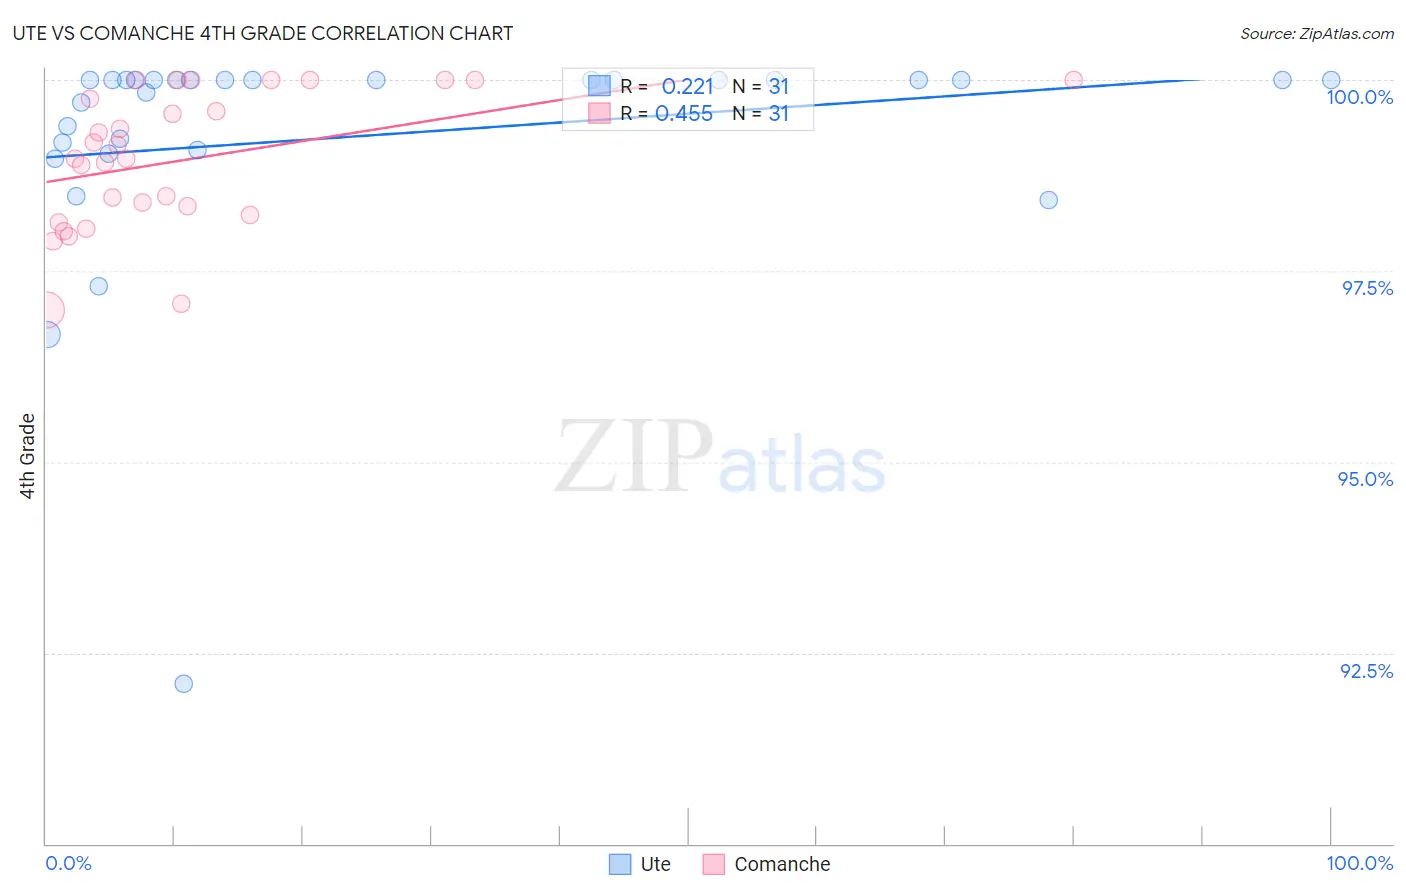
Ute vs Comanche 4th Grade Correlation Chart
The statistical analysis conducted on geographies consisting of 55,668,289 people shows a weak positive correlation between the proportion of Ute and percentage of population with at least 4th grade education in the United States with a correlation coefficient (R) of 0.221 and weighted average of 97.7%. Similarly, the statistical analysis conducted on geographies consisting of 109,786,530 people shows a moderate positive correlation between the proportion of Comanche and percentage of population with at least 4th grade education in the United States with a correlation coefficient (R) of 0.455 and weighted average of 97.5%, a difference of 0.15%.
4th Grade Correlation Summary
| Measurement | Ute | Comanche |
| Minimum | 92.1% | 97.0% |
| Maximum | 100.0% | 100.0% |
| Range | 7.9% | 3.0% |
| Mean | 99.3% | 99.0% |
| Median | 100.0% | 99.0% |
| Interquartile 25% (IQ1) | 99.1% | 98.2% |
| Interquartile 75% (IQ3) | 100.0% | 100.0% |
| Interquartile Range (IQR) | 0.92% | 1.8% |
| Standard Deviation (Sample) | 1.6% | 0.90% |
| Standard Deviation (Population) | 1.5% | 0.88% |
Similar Demographics by 4th Grade
Demographics Similar to Ute by 4th Grade
In terms of 4th grade, the demographic groups most similar to Ute are Jordanian (97.7%, a difference of 0.0%), Hopi (97.7%, a difference of 0.0%), Burmese (97.7%, a difference of 0.010%), Spaniard (97.7%, a difference of 0.010%), and Immigrants from Moldova (97.7%, a difference of 0.010%).
| Demographics | Rating | Rank | 4th Grade |
| Filipinos | 84.0 /100 | #140 | Excellent 97.7% |
| Immigrants | Greece | 83.8 /100 | #141 | Excellent 97.7% |
| Immigrants | North Macedonia | 83.3 /100 | #142 | Excellent 97.7% |
| Burmese | 82.8 /100 | #143 | Excellent 97.7% |
| Spaniards | 82.7 /100 | #144 | Excellent 97.7% |
| Immigrants | Moldova | 82.4 /100 | #145 | Excellent 97.7% |
| Jordanians | 81.3 /100 | #146 | Excellent 97.7% |
| Ute | 80.6 /100 | #147 | Excellent 97.7% |
| Hopi | 80.6 /100 | #148 | Excellent 97.7% |
| Soviet Union | 77.8 /100 | #149 | Good 97.6% |
| Immigrants | Israel | 77.7 /100 | #150 | Good 97.6% |
| Alsatians | 77.2 /100 | #151 | Good 97.6% |
| Immigrants | South Central Asia | 76.2 /100 | #152 | Good 97.6% |
| Immigrants | Eastern Europe | 71.3 /100 | #153 | Good 97.6% |
| Immigrants | Russia | 67.0 /100 | #154 | Good 97.6% |
Demographics Similar to Comanche by 4th Grade
In terms of 4th grade, the demographic groups most similar to Comanche are Immigrants from Brazil (97.5%, a difference of 0.0%), Arab (97.5%, a difference of 0.010%), Immigrants from Kazakhstan (97.5%, a difference of 0.010%), Immigrants from Venezuela (97.5%, a difference of 0.010%), and Immigrants from Taiwan (97.5%, a difference of 0.010%).
| Demographics | Rating | Rank | 4th Grade |
| Brazilians | 51.5 /100 | #171 | Average 97.5% |
| Immigrants | Sri Lanka | 51.1 /100 | #172 | Average 97.5% |
| Immigrants | Korea | 50.6 /100 | #173 | Average 97.5% |
| Egyptians | 50.0 /100 | #174 | Average 97.5% |
| Immigrants | Micronesia | 49.6 /100 | #175 | Average 97.5% |
| Arabs | 48.7 /100 | #176 | Average 97.5% |
| Immigrants | Brazil | 46.1 /100 | #177 | Average 97.5% |
| Comanche | 45.3 /100 | #178 | Average 97.5% |
| Immigrants | Kazakhstan | 43.6 /100 | #179 | Average 97.5% |
| Immigrants | Venezuela | 42.7 /100 | #180 | Average 97.5% |
| Immigrants | Taiwan | 41.5 /100 | #181 | Average 97.5% |
| Spanish Americans | 39.3 /100 | #182 | Fair 97.5% |
| Argentineans | 39.0 /100 | #183 | Fair 97.5% |
| Pakistanis | 36.2 /100 | #184 | Fair 97.5% |
| Immigrants | Kenya | 35.8 /100 | #185 | Fair 97.5% |