Barbadian vs Comanche 4th Grade
COMPARE
Barbadian
Comanche
4th Grade
4th Grade Comparison
Barbadians
Comanche
96.9%
4TH GRADE
0.1/ 100
METRIC RATING
280th/ 347
METRIC RANK
97.5%
4TH GRADE
45.3/ 100
METRIC RATING
178th/ 347
METRIC RANK
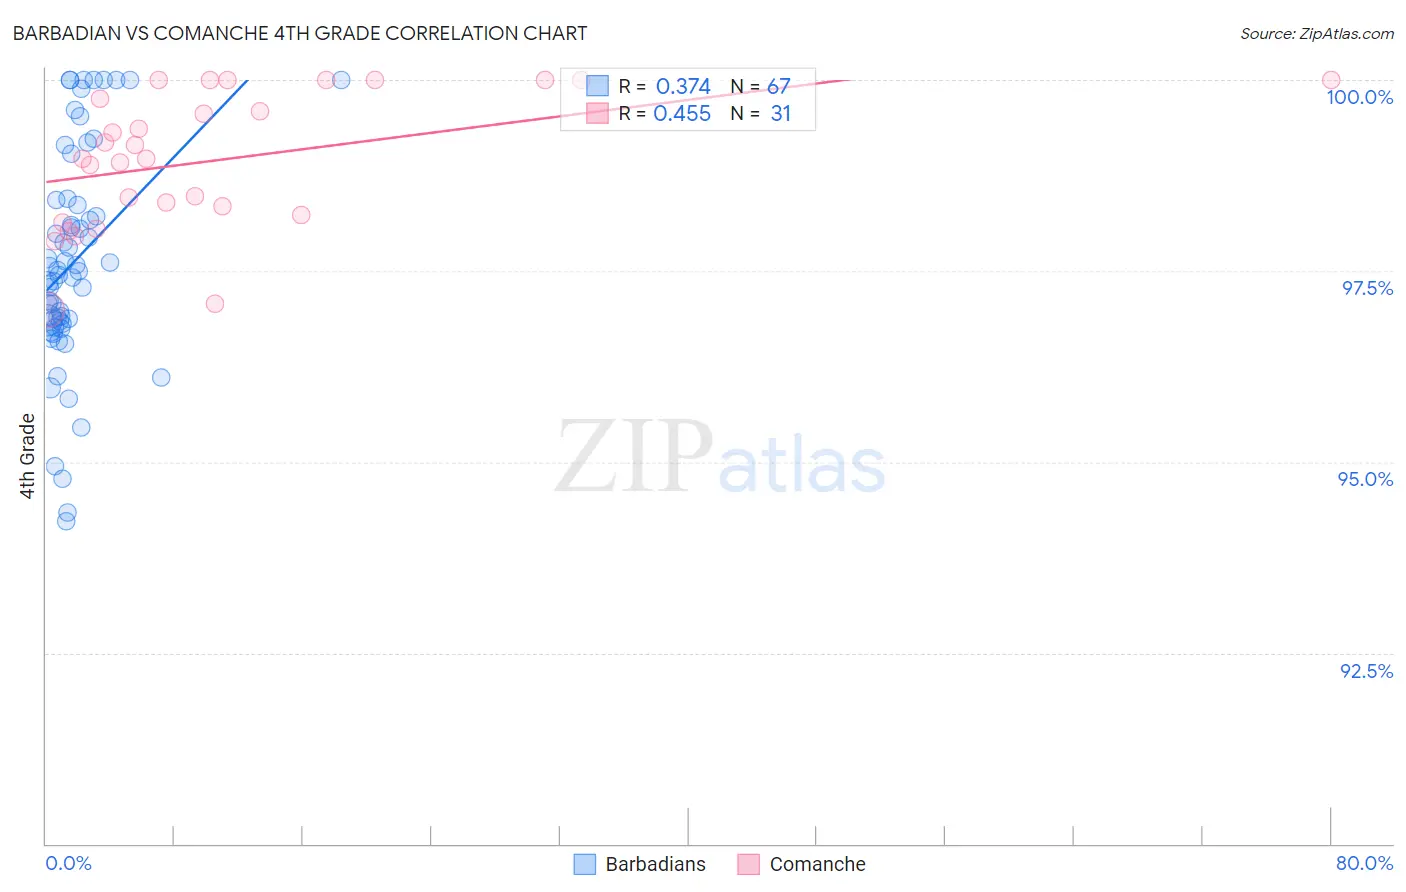
Barbadian vs Comanche 4th Grade Correlation Chart
The statistical analysis conducted on geographies consisting of 141,304,590 people shows a mild positive correlation between the proportion of Barbadians and percentage of population with at least 4th grade education in the United States with a correlation coefficient (R) of 0.374 and weighted average of 96.9%. Similarly, the statistical analysis conducted on geographies consisting of 109,786,530 people shows a moderate positive correlation between the proportion of Comanche and percentage of population with at least 4th grade education in the United States with a correlation coefficient (R) of 0.455 and weighted average of 97.5%, a difference of 0.66%.
4th Grade Correlation Summary
| Measurement | Barbadian | Comanche |
| Minimum | 94.2% | 97.0% |
| Maximum | 100.0% | 100.0% |
| Range | 5.8% | 3.0% |
| Mean | 97.6% | 99.0% |
| Median | 97.5% | 99.0% |
| Interquartile 25% (IQ1) | 96.8% | 98.2% |
| Interquartile 75% (IQ3) | 98.4% | 100.0% |
| Interquartile Range (IQR) | 1.6% | 1.8% |
| Standard Deviation (Sample) | 1.4% | 0.90% |
| Standard Deviation (Population) | 1.4% | 0.88% |
Similar Demographics by 4th Grade
Demographics Similar to Barbadians by 4th Grade
In terms of 4th grade, the demographic groups most similar to Barbadians are Afghan (96.9%, a difference of 0.010%), Immigrants from Hong Kong (96.9%, a difference of 0.010%), Yaqui (96.9%, a difference of 0.020%), Immigrants from Western Africa (96.9%, a difference of 0.020%), and Immigrants from Bolivia (96.9%, a difference of 0.020%).
| Demographics | Rating | Rank | 4th Grade |
| Immigrants | Cameroon | 0.1 /100 | #273 | Tragic 96.9% |
| Trinidadians and Tobagonians | 0.1 /100 | #274 | Tragic 96.9% |
| Immigrants | Ghana | 0.1 /100 | #275 | Tragic 96.9% |
| Yaqui | 0.1 /100 | #276 | Tragic 96.9% |
| Immigrants | Western Africa | 0.1 /100 | #277 | Tragic 96.9% |
| Immigrants | Bolivia | 0.1 /100 | #278 | Tragic 96.9% |
| Afghans | 0.1 /100 | #279 | Tragic 96.9% |
| Barbadians | 0.1 /100 | #280 | Tragic 96.9% |
| Immigrants | Hong Kong | 0.1 /100 | #281 | Tragic 96.9% |
| Immigrants | Trinidad and Tobago | 0.1 /100 | #282 | Tragic 96.8% |
| Immigrants | Philippines | 0.1 /100 | #283 | Tragic 96.8% |
| Immigrants | St. Vincent and the Grenadines | 0.1 /100 | #284 | Tragic 96.8% |
| Immigrants | Barbados | 0.0 /100 | #285 | Tragic 96.8% |
| Immigrants | Thailand | 0.0 /100 | #286 | Tragic 96.8% |
| Houma | 0.0 /100 | #287 | Tragic 96.8% |
Demographics Similar to Comanche by 4th Grade
In terms of 4th grade, the demographic groups most similar to Comanche are Immigrants from Brazil (97.5%, a difference of 0.0%), Arab (97.5%, a difference of 0.010%), Immigrants from Kazakhstan (97.5%, a difference of 0.010%), Immigrants from Venezuela (97.5%, a difference of 0.010%), and Immigrants from Taiwan (97.5%, a difference of 0.010%).
| Demographics | Rating | Rank | 4th Grade |
| Brazilians | 51.5 /100 | #171 | Average 97.5% |
| Immigrants | Sri Lanka | 51.1 /100 | #172 | Average 97.5% |
| Immigrants | Korea | 50.6 /100 | #173 | Average 97.5% |
| Egyptians | 50.0 /100 | #174 | Average 97.5% |
| Immigrants | Micronesia | 49.6 /100 | #175 | Average 97.5% |
| Arabs | 48.7 /100 | #176 | Average 97.5% |
| Immigrants | Brazil | 46.1 /100 | #177 | Average 97.5% |
| Comanche | 45.3 /100 | #178 | Average 97.5% |
| Immigrants | Kazakhstan | 43.6 /100 | #179 | Average 97.5% |
| Immigrants | Venezuela | 42.7 /100 | #180 | Average 97.5% |
| Immigrants | Taiwan | 41.5 /100 | #181 | Average 97.5% |
| Spanish Americans | 39.3 /100 | #182 | Fair 97.5% |
| Argentineans | 39.0 /100 | #183 | Fair 97.5% |
| Pakistanis | 36.2 /100 | #184 | Fair 97.5% |
| Immigrants | Kenya | 35.8 /100 | #185 | Fair 97.5% |