Mongolian vs Bermudan 4th Grade
COMPARE
Mongolian
Bermudan
4th Grade
4th Grade Comparison
Mongolians
Bermudans
97.5%
4TH GRADE
34.7/ 100
METRIC RATING
187th/ 347
METRIC RANK
97.6%
4TH GRADE
60.5/ 100
METRIC RATING
162nd/ 347
METRIC RANK
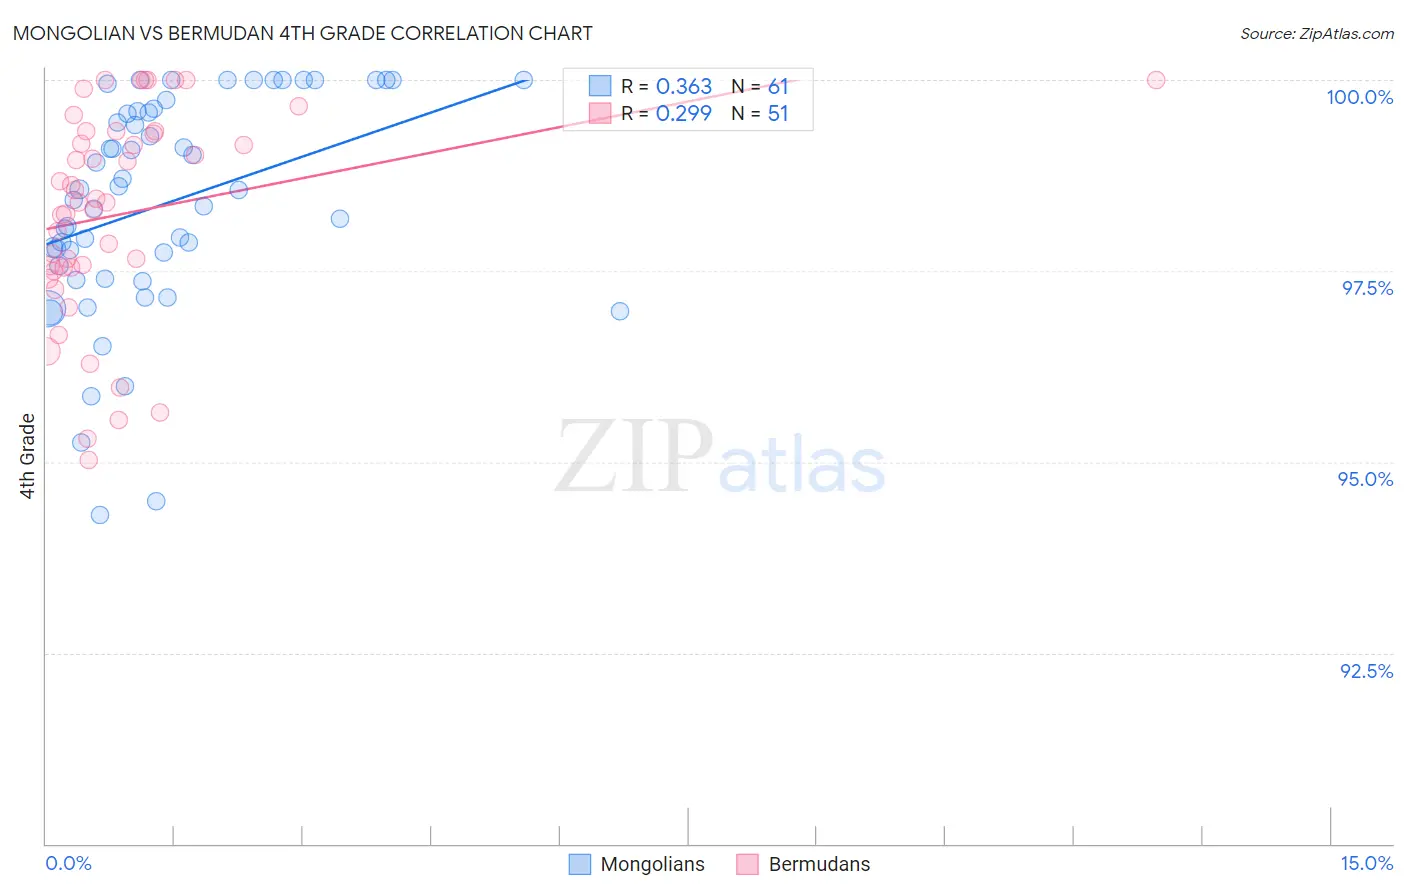
Mongolian vs Bermudan 4th Grade Correlation Chart
The statistical analysis conducted on geographies consisting of 140,362,004 people shows a mild positive correlation between the proportion of Mongolians and percentage of population with at least 4th grade education in the United States with a correlation coefficient (R) of 0.363 and weighted average of 97.5%. Similarly, the statistical analysis conducted on geographies consisting of 55,721,975 people shows a weak positive correlation between the proportion of Bermudans and percentage of population with at least 4th grade education in the United States with a correlation coefficient (R) of 0.299 and weighted average of 97.6%, a difference of 0.10%.
4th Grade Correlation Summary
| Measurement | Mongolian | Bermudan |
| Minimum | 94.3% | 95.0% |
| Maximum | 100.0% | 100.0% |
| Range | 5.7% | 5.0% |
| Mean | 98.4% | 98.3% |
| Median | 98.6% | 98.4% |
| Interquartile 25% (IQ1) | 97.5% | 97.5% |
| Interquartile 75% (IQ3) | 99.6% | 99.3% |
| Interquartile Range (IQR) | 2.1% | 1.8% |
| Standard Deviation (Sample) | 1.4% | 1.4% |
| Standard Deviation (Population) | 1.4% | 1.3% |
Similar Demographics by 4th Grade
Demographics Similar to Mongolians by 4th Grade
In terms of 4th grade, the demographic groups most similar to Mongolians are Immigrants from Kenya (97.5%, a difference of 0.0%), Dutch West Indian (97.5%, a difference of 0.0%), Immigrants from Argentina (97.5%, a difference of 0.0%), Pakistani (97.5%, a difference of 0.010%), and Panamanian (97.4%, a difference of 0.010%).
| Demographics | Rating | Rank | 4th Grade |
| Immigrants | Venezuela | 42.7 /100 | #180 | Average 97.5% |
| Immigrants | Taiwan | 41.5 /100 | #181 | Average 97.5% |
| Spanish Americans | 39.3 /100 | #182 | Fair 97.5% |
| Argentineans | 39.0 /100 | #183 | Fair 97.5% |
| Pakistanis | 36.2 /100 | #184 | Fair 97.5% |
| Immigrants | Kenya | 35.8 /100 | #185 | Fair 97.5% |
| Dutch West Indians | 35.8 /100 | #186 | Fair 97.5% |
| Mongolians | 34.7 /100 | #187 | Fair 97.5% |
| Immigrants | Argentina | 34.6 /100 | #188 | Fair 97.5% |
| Panamanians | 31.9 /100 | #189 | Fair 97.4% |
| Blacks/African Americans | 31.1 /100 | #190 | Fair 97.4% |
| Navajo | 30.7 /100 | #191 | Fair 97.4% |
| Immigrants | Ukraine | 30.1 /100 | #192 | Fair 97.4% |
| Immigrants | Egypt | 30.1 /100 | #193 | Fair 97.4% |
| Portuguese | 29.2 /100 | #194 | Fair 97.4% |
Demographics Similar to Bermudans by 4th Grade
In terms of 4th grade, the demographic groups most similar to Bermudans are Apache (97.6%, a difference of 0.0%), Marshallese (97.6%, a difference of 0.0%), Immigrants from Iran (97.6%, a difference of 0.0%), Immigrants from Italy (97.6%, a difference of 0.010%), and Ugandan (97.6%, a difference of 0.010%).
| Demographics | Rating | Rank | 4th Grade |
| Albanians | 67.0 /100 | #155 | Good 97.6% |
| Immigrants | Jordan | 66.9 /100 | #156 | Good 97.6% |
| Immigrants | Bosnia and Herzegovina | 66.0 /100 | #157 | Good 97.6% |
| French American Indians | 65.9 /100 | #158 | Good 97.6% |
| Immigrants | Italy | 63.7 /100 | #159 | Good 97.6% |
| Apache | 61.3 /100 | #160 | Good 97.6% |
| Marshallese | 60.8 /100 | #161 | Good 97.6% |
| Bermudans | 60.5 /100 | #162 | Good 97.6% |
| Immigrants | Iran | 60.3 /100 | #163 | Good 97.6% |
| Ugandans | 58.9 /100 | #164 | Average 97.6% |
| Venezuelans | 58.7 /100 | #165 | Average 97.6% |
| Kenyans | 56.5 /100 | #166 | Average 97.5% |
| Immigrants | Poland | 55.9 /100 | #167 | Average 97.5% |
| Immigrants | Belarus | 55.8 /100 | #168 | Average 97.5% |
| Chileans | 54.4 /100 | #169 | Average 97.5% |