Mongolian vs Comanche In Labor Force | Age 25-29
COMPARE
Mongolian
Comanche
In Labor Force | Age 25-29
In Labor Force | Age 25-29 Comparison
Mongolians
Comanche
85.1%
IN LABOR FORCE | AGE 25-29
94.1/ 100
METRIC RATING
98th/ 347
METRIC RANK
81.9%
IN LABOR FORCE | AGE 25-29
0.0/ 100
METRIC RATING
318th/ 347
METRIC RANK
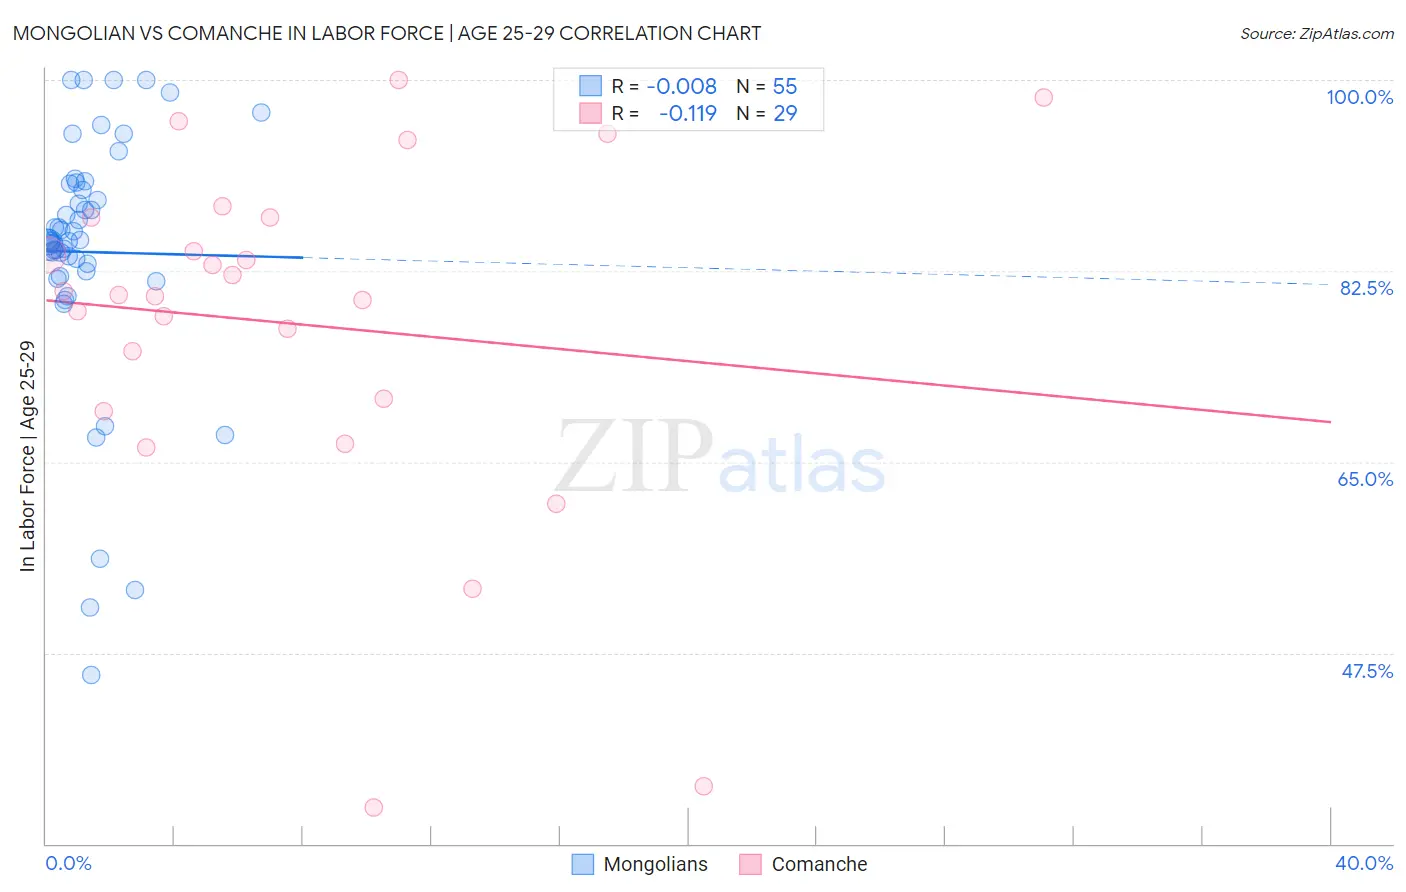
Mongolian vs Comanche In Labor Force | Age 25-29 Correlation Chart
The statistical analysis conducted on geographies consisting of 140,349,475 people shows no correlation between the proportion of Mongolians and labor force participation rate among population between the ages 25 and 29 in the United States with a correlation coefficient (R) of -0.008 and weighted average of 85.1%. Similarly, the statistical analysis conducted on geographies consisting of 109,769,144 people shows a poor negative correlation between the proportion of Comanche and labor force participation rate among population between the ages 25 and 29 in the United States with a correlation coefficient (R) of -0.119 and weighted average of 81.9%, a difference of 3.9%.
In Labor Force | Age 25-29 Correlation Summary
| Measurement | Mongolian | Comanche |
| Minimum | 45.5% | 33.3% |
| Maximum | 100.0% | 100.0% |
| Range | 54.5% | 66.7% |
| Mean | 84.2% | 77.6% |
| Median | 85.2% | 80.3% |
| Interquartile 25% (IQ1) | 82.5% | 70.2% |
| Interquartile 75% (IQ3) | 90.5% | 87.4% |
| Interquartile Range (IQR) | 8.0% | 17.2% |
| Standard Deviation (Sample) | 11.7% | 16.2% |
| Standard Deviation (Population) | 11.6% | 15.9% |
Similar Demographics by In Labor Force | Age 25-29
Demographics Similar to Mongolians by In Labor Force | Age 25-29
In terms of in labor force | age 25-29, the demographic groups most similar to Mongolians are Bangladeshi (85.1%, a difference of 0.0%), Immigrants from Sudan (85.1%, a difference of 0.010%), Immigrants from Switzerland (85.1%, a difference of 0.010%), Egyptian (85.1%, a difference of 0.010%), and Slavic (85.1%, a difference of 0.010%).
| Demographics | Rating | Rank | In Labor Force | Age 25-29 |
| Immigrants | Moldova | 95.8 /100 | #91 | Exceptional 85.1% |
| Immigrants | Costa Rica | 95.5 /100 | #92 | Exceptional 85.1% |
| Austrians | 95.3 /100 | #93 | Exceptional 85.1% |
| Immigrants | Korea | 94.8 /100 | #94 | Exceptional 85.1% |
| Immigrants | Netherlands | 94.6 /100 | #95 | Exceptional 85.1% |
| Immigrants | Romania | 94.6 /100 | #96 | Exceptional 85.1% |
| Immigrants | Sudan | 94.3 /100 | #97 | Exceptional 85.1% |
| Mongolians | 94.1 /100 | #98 | Exceptional 85.1% |
| Bangladeshis | 94.0 /100 | #99 | Exceptional 85.1% |
| Immigrants | Switzerland | 93.9 /100 | #100 | Exceptional 85.1% |
| Egyptians | 93.8 /100 | #101 | Exceptional 85.1% |
| Slavs | 93.7 /100 | #102 | Exceptional 85.1% |
| Immigrants | Japan | 93.5 /100 | #103 | Exceptional 85.1% |
| Immigrants | Zaire | 93.3 /100 | #104 | Exceptional 85.1% |
| Immigrants | Hong Kong | 92.8 /100 | #105 | Exceptional 85.0% |
Demographics Similar to Comanche by In Labor Force | Age 25-29
In terms of in labor force | age 25-29, the demographic groups most similar to Comanche are Chickasaw (81.9%, a difference of 0.010%), Mexican (81.9%, a difference of 0.090%), Immigrants from Mexico (82.0%, a difference of 0.17%), Seminole (81.7%, a difference of 0.22%), and Colville (81.6%, a difference of 0.27%).
| Demographics | Rating | Rank | In Labor Force | Age 25-29 |
| Alaskan Athabascans | 0.0 /100 | #311 | Tragic 82.3% |
| Hispanics or Latinos | 0.0 /100 | #312 | Tragic 82.2% |
| Yaqui | 0.0 /100 | #313 | Tragic 82.2% |
| Cherokee | 0.0 /100 | #314 | Tragic 82.1% |
| Immigrants | Mexico | 0.0 /100 | #315 | Tragic 82.0% |
| Mexicans | 0.0 /100 | #316 | Tragic 81.9% |
| Chickasaw | 0.0 /100 | #317 | Tragic 81.9% |
| Comanche | 0.0 /100 | #318 | Tragic 81.9% |
| Seminole | 0.0 /100 | #319 | Tragic 81.7% |
| Colville | 0.0 /100 | #320 | Tragic 81.6% |
| Shoshone | 0.0 /100 | #321 | Tragic 81.6% |
| Kiowa | 0.0 /100 | #322 | Tragic 81.6% |
| Alaska Natives | 0.0 /100 | #323 | Tragic 81.6% |
| Houma | 0.0 /100 | #324 | Tragic 81.2% |
| Dutch West Indians | 0.0 /100 | #325 | Tragic 81.1% |