Mongolian vs Comanche Currently Married
COMPARE
Mongolian
Comanche
Currently Married
Currently Married Comparison
Mongolians
Comanche
46.4%
CURRENTLY MARRIED
37.6/ 100
METRIC RATING
185th/ 347
METRIC RANK
45.0%
CURRENTLY MARRIED
2.1/ 100
METRIC RATING
226th/ 347
METRIC RANK
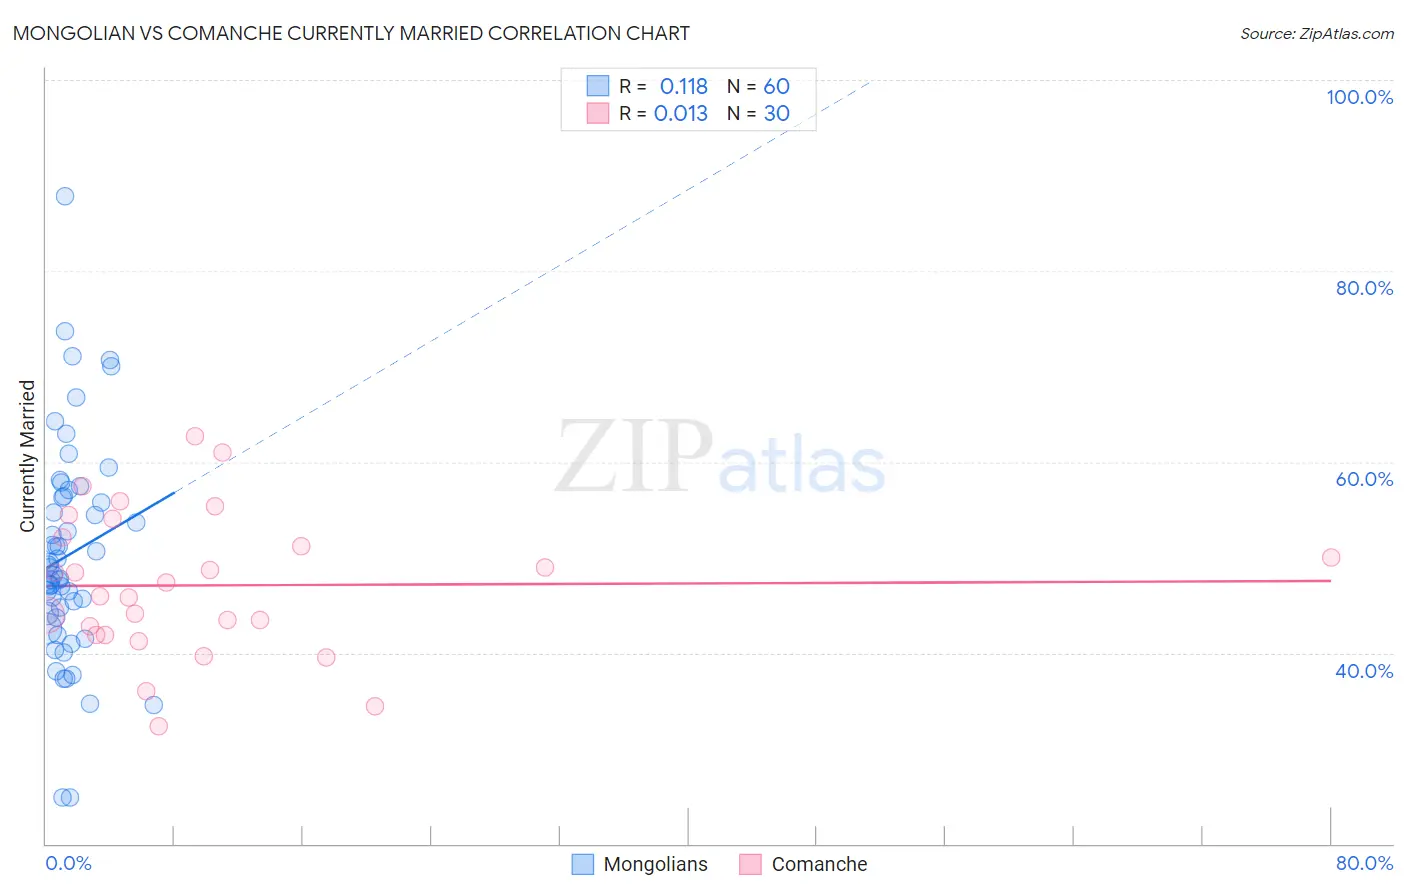
Mongolian vs Comanche Currently Married Correlation Chart
The statistical analysis conducted on geographies consisting of 140,349,335 people shows a poor positive correlation between the proportion of Mongolians and percentage of population currently married in the United States with a correlation coefficient (R) of 0.118 and weighted average of 46.4%. Similarly, the statistical analysis conducted on geographies consisting of 109,782,091 people shows no correlation between the proportion of Comanche and percentage of population currently married in the United States with a correlation coefficient (R) of 0.013 and weighted average of 45.0%, a difference of 3.2%.
Currently Married Correlation Summary
| Measurement | Mongolian | Comanche |
| Minimum | 24.8% | 32.3% |
| Maximum | 87.8% | 62.7% |
| Range | 63.0% | 30.4% |
| Mean | 50.2% | 47.1% |
| Median | 48.6% | 46.6% |
| Interquartile 25% (IQ1) | 43.9% | 41.8% |
| Interquartile 75% (IQ3) | 56.3% | 52.1% |
| Interquartile Range (IQR) | 12.4% | 10.2% |
| Standard Deviation (Sample) | 11.3% | 7.5% |
| Standard Deviation (Population) | 11.3% | 7.4% |
Similar Demographics by Currently Married
Demographics Similar to Mongolians by Currently Married
In terms of currently married, the demographic groups most similar to Mongolians are Immigrants from Chile (46.4%, a difference of 0.030%), Brazilian (46.4%, a difference of 0.070%), Immigrants from Northern Africa (46.5%, a difference of 0.080%), Immigrants from Peru (46.4%, a difference of 0.090%), and Potawatomi (46.5%, a difference of 0.16%).
| Demographics | Rating | Rank | Currently Married |
| Chickasaw | 47.8 /100 | #178 | Average 46.6% |
| Immigrants | Oceania | 44.6 /100 | #179 | Average 46.5% |
| Costa Ricans | 43.7 /100 | #180 | Average 46.5% |
| Ottawa | 43.0 /100 | #181 | Average 46.5% |
| Potawatomi | 41.9 /100 | #182 | Average 46.5% |
| Immigrants | Northern Africa | 39.7 /100 | #183 | Fair 46.5% |
| Brazilians | 39.3 /100 | #184 | Fair 46.4% |
| Mongolians | 37.6 /100 | #185 | Fair 46.4% |
| Immigrants | Chile | 36.8 /100 | #186 | Fair 46.4% |
| Immigrants | Peru | 35.3 /100 | #187 | Fair 46.4% |
| Colombians | 31.8 /100 | #188 | Fair 46.3% |
| Fijians | 30.3 /100 | #189 | Fair 46.3% |
| Choctaw | 29.1 /100 | #190 | Fair 46.3% |
| Immigrants | France | 27.7 /100 | #191 | Fair 46.2% |
| Soviet Union | 25.7 /100 | #192 | Fair 46.2% |
Demographics Similar to Comanche by Currently Married
In terms of currently married, the demographic groups most similar to Comanche are Spanish American (45.0%, a difference of 0.0%), Immigrants from Uruguay (45.0%, a difference of 0.010%), Immigrants from Uganda (45.0%, a difference of 0.050%), French American Indian (45.0%, a difference of 0.050%), and Immigrants from Laos (45.0%, a difference of 0.10%).
| Demographics | Rating | Rank | Currently Married |
| Immigrants | Portugal | 3.5 /100 | #219 | Tragic 45.2% |
| Kenyans | 3.1 /100 | #220 | Tragic 45.2% |
| Mexicans | 3.0 /100 | #221 | Tragic 45.2% |
| Immigrants | Azores | 2.5 /100 | #222 | Tragic 45.1% |
| Immigrants | Laos | 2.3 /100 | #223 | Tragic 45.0% |
| Immigrants | Uganda | 2.2 /100 | #224 | Tragic 45.0% |
| French American Indians | 2.2 /100 | #225 | Tragic 45.0% |
| Comanche | 2.1 /100 | #226 | Tragic 45.0% |
| Spanish Americans | 2.1 /100 | #227 | Tragic 45.0% |
| Immigrants | Uruguay | 2.0 /100 | #228 | Tragic 45.0% |
| Cree | 1.7 /100 | #229 | Tragic 44.9% |
| Immigrants | Kenya | 1.6 /100 | #230 | Tragic 44.9% |
| Immigrants | Panama | 1.5 /100 | #231 | Tragic 44.9% |
| Nepalese | 1.2 /100 | #232 | Tragic 44.7% |
| Immigrants | Saudi Arabia | 1.1 /100 | #233 | Tragic 44.7% |