Mongolian vs Immigrants from Uganda 4th Grade
COMPARE
Mongolian
Immigrants from Uganda
4th Grade
4th Grade Comparison
Mongolians
Immigrants from Uganda
97.5%
4TH GRADE
34.7/ 100
METRIC RATING
187th/ 347
METRIC RANK
97.4%
4TH GRADE
19.8/ 100
METRIC RATING
200th/ 347
METRIC RANK
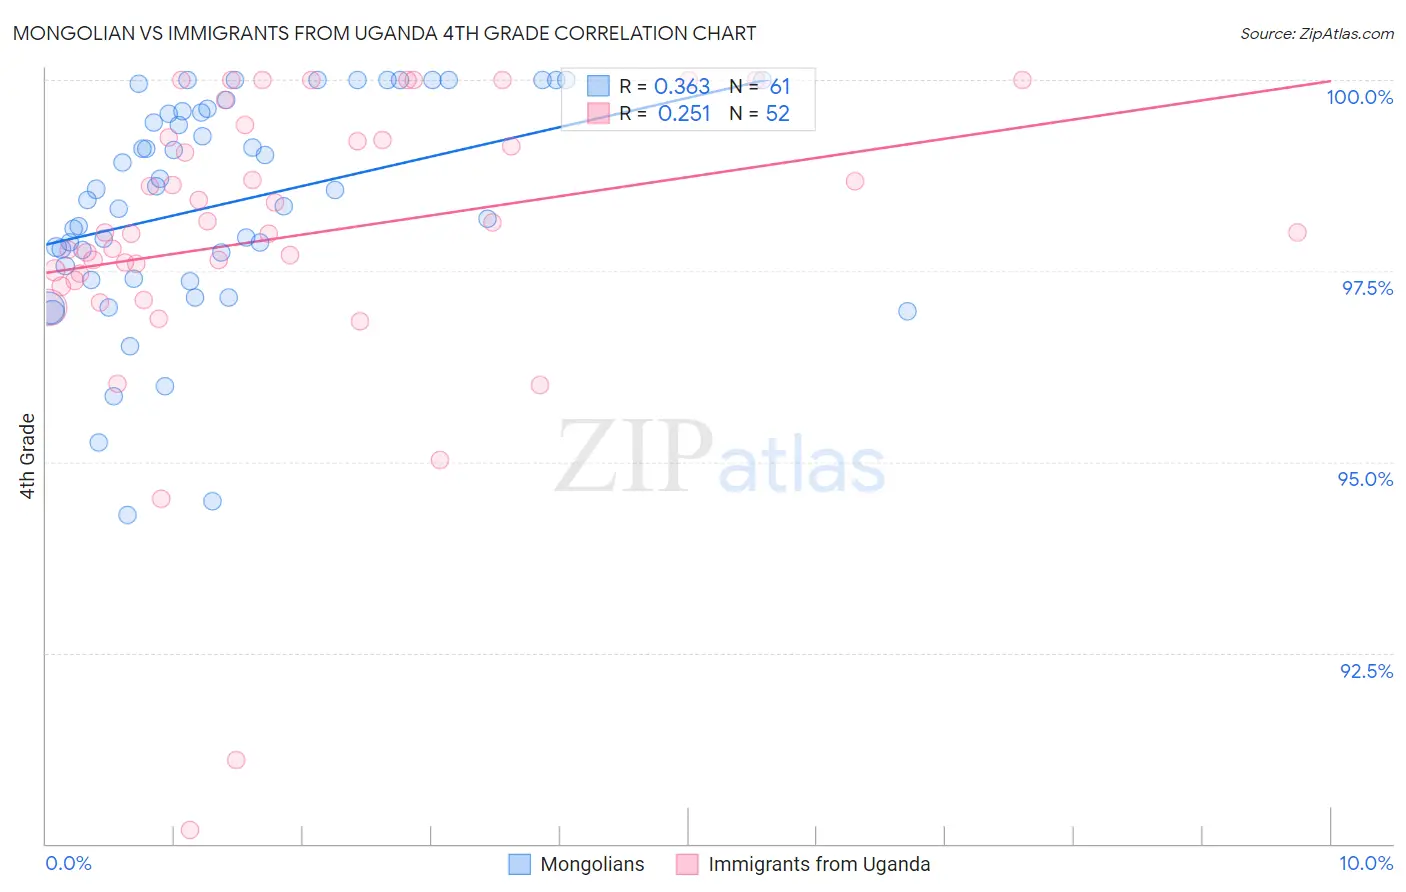
Mongolian vs Immigrants from Uganda 4th Grade Correlation Chart
The statistical analysis conducted on geographies consisting of 140,362,004 people shows a mild positive correlation between the proportion of Mongolians and percentage of population with at least 4th grade education in the United States with a correlation coefficient (R) of 0.363 and weighted average of 97.5%. Similarly, the statistical analysis conducted on geographies consisting of 125,941,298 people shows a weak positive correlation between the proportion of Immigrants from Uganda and percentage of population with at least 4th grade education in the United States with a correlation coefficient (R) of 0.251 and weighted average of 97.4%, a difference of 0.070%.
4th Grade Correlation Summary
| Measurement | Mongolian | Immigrants from Uganda |
| Minimum | 94.3% | 90.2% |
| Maximum | 100.0% | 100.0% |
| Range | 5.7% | 9.8% |
| Mean | 98.4% | 98.0% |
| Median | 98.6% | 98.0% |
| Interquartile 25% (IQ1) | 97.5% | 97.4% |
| Interquartile 75% (IQ3) | 99.6% | 99.2% |
| Interquartile Range (IQR) | 2.1% | 1.8% |
| Standard Deviation (Sample) | 1.4% | 2.0% |
| Standard Deviation (Population) | 1.4% | 2.0% |
Demographics Similar to Mongolians and Immigrants from Uganda by 4th Grade
In terms of 4th grade, the demographic groups most similar to Mongolians are Immigrants from Kenya (97.5%, a difference of 0.0%), Dutch West Indian (97.5%, a difference of 0.0%), Immigrants from Argentina (97.5%, a difference of 0.0%), Pakistani (97.5%, a difference of 0.010%), and Panamanian (97.4%, a difference of 0.010%). Similarly, the demographic groups most similar to Immigrants from Uganda are Native/Alaskan (97.4%, a difference of 0.010%), Guamanian/Chamorro (97.4%, a difference of 0.020%), Immigrants from Southern Europe (97.4%, a difference of 0.020%), Immigrants from Chile (97.4%, a difference of 0.020%), and Hawaiian (97.4%, a difference of 0.030%).
| Demographics | Rating | Rank | 4th Grade |
| Argentineans | 39.0 /100 | #183 | Fair 97.5% |
| Pakistanis | 36.2 /100 | #184 | Fair 97.5% |
| Immigrants | Kenya | 35.8 /100 | #185 | Fair 97.5% |
| Dutch West Indians | 35.8 /100 | #186 | Fair 97.5% |
| Mongolians | 34.7 /100 | #187 | Fair 97.5% |
| Immigrants | Argentina | 34.6 /100 | #188 | Fair 97.5% |
| Panamanians | 31.9 /100 | #189 | Fair 97.4% |
| Blacks/African Americans | 31.1 /100 | #190 | Fair 97.4% |
| Navajo | 30.7 /100 | #191 | Fair 97.4% |
| Immigrants | Ukraine | 30.1 /100 | #192 | Fair 97.4% |
| Immigrants | Egypt | 30.1 /100 | #193 | Fair 97.4% |
| Portuguese | 29.2 /100 | #194 | Fair 97.4% |
| Paraguayans | 28.9 /100 | #195 | Fair 97.4% |
| Immigrants | Albania | 27.7 /100 | #196 | Fair 97.4% |
| Hawaiians | 25.6 /100 | #197 | Fair 97.4% |
| Guamanians/Chamorros | 23.0 /100 | #198 | Fair 97.4% |
| Natives/Alaskans | 20.6 /100 | #199 | Fair 97.4% |
| Immigrants | Uganda | 19.8 /100 | #200 | Poor 97.4% |
| Immigrants | Southern Europe | 16.2 /100 | #201 | Poor 97.4% |
| Immigrants | Chile | 16.1 /100 | #202 | Poor 97.4% |
| Immigrants | Northern Africa | 15.1 /100 | #203 | Poor 97.4% |