Mongolian vs Immigrants from Yemen 4th Grade
COMPARE
Mongolian
Immigrants from Yemen
4th Grade
4th Grade Comparison
Mongolians
Immigrants from Yemen
97.5%
4TH GRADE
34.7/ 100
METRIC RATING
187th/ 347
METRIC RANK
95.2%
4TH GRADE
0.0/ 100
METRIC RATING
341st/ 347
METRIC RANK
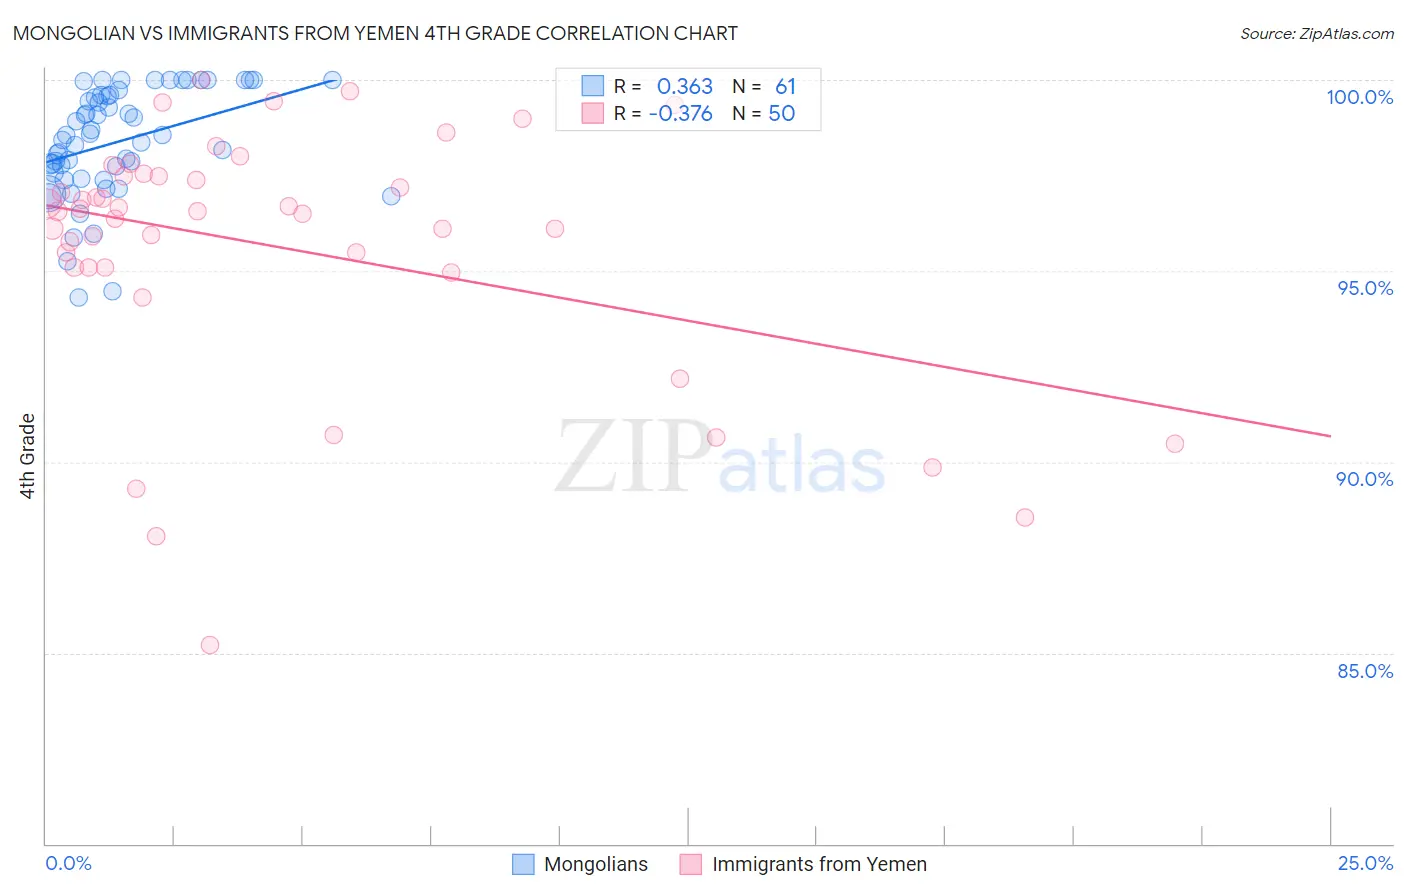
Mongolian vs Immigrants from Yemen 4th Grade Correlation Chart
The statistical analysis conducted on geographies consisting of 140,362,004 people shows a mild positive correlation between the proportion of Mongolians and percentage of population with at least 4th grade education in the United States with a correlation coefficient (R) of 0.363 and weighted average of 97.5%. Similarly, the statistical analysis conducted on geographies consisting of 82,431,774 people shows a mild negative correlation between the proportion of Immigrants from Yemen and percentage of population with at least 4th grade education in the United States with a correlation coefficient (R) of -0.376 and weighted average of 95.2%, a difference of 2.4%.
4th Grade Correlation Summary
| Measurement | Mongolian | Immigrants from Yemen |
| Minimum | 94.3% | 85.2% |
| Maximum | 100.0% | 100.0% |
| Range | 5.7% | 14.8% |
| Mean | 98.4% | 95.6% |
| Median | 98.6% | 96.6% |
| Interquartile 25% (IQ1) | 97.5% | 95.1% |
| Interquartile 75% (IQ3) | 99.6% | 97.5% |
| Interquartile Range (IQR) | 2.1% | 2.4% |
| Standard Deviation (Sample) | 1.4% | 3.3% |
| Standard Deviation (Population) | 1.4% | 3.3% |
Similar Demographics by 4th Grade
Demographics Similar to Mongolians by 4th Grade
In terms of 4th grade, the demographic groups most similar to Mongolians are Immigrants from Kenya (97.5%, a difference of 0.0%), Dutch West Indian (97.5%, a difference of 0.0%), Immigrants from Argentina (97.5%, a difference of 0.0%), Pakistani (97.5%, a difference of 0.010%), and Panamanian (97.4%, a difference of 0.010%).
| Demographics | Rating | Rank | 4th Grade |
| Immigrants | Venezuela | 42.7 /100 | #180 | Average 97.5% |
| Immigrants | Taiwan | 41.5 /100 | #181 | Average 97.5% |
| Spanish Americans | 39.3 /100 | #182 | Fair 97.5% |
| Argentineans | 39.0 /100 | #183 | Fair 97.5% |
| Pakistanis | 36.2 /100 | #184 | Fair 97.5% |
| Immigrants | Kenya | 35.8 /100 | #185 | Fair 97.5% |
| Dutch West Indians | 35.8 /100 | #186 | Fair 97.5% |
| Mongolians | 34.7 /100 | #187 | Fair 97.5% |
| Immigrants | Argentina | 34.6 /100 | #188 | Fair 97.5% |
| Panamanians | 31.9 /100 | #189 | Fair 97.4% |
| Blacks/African Americans | 31.1 /100 | #190 | Fair 97.4% |
| Navajo | 30.7 /100 | #191 | Fair 97.4% |
| Immigrants | Ukraine | 30.1 /100 | #192 | Fair 97.4% |
| Immigrants | Egypt | 30.1 /100 | #193 | Fair 97.4% |
| Portuguese | 29.2 /100 | #194 | Fair 97.4% |
Demographics Similar to Immigrants from Yemen by 4th Grade
In terms of 4th grade, the demographic groups most similar to Immigrants from Yemen are Yakama (95.2%, a difference of 0.010%), Immigrants from Central America (95.1%, a difference of 0.080%), Guatemalan (95.3%, a difference of 0.11%), Immigrants from Guatemala (95.1%, a difference of 0.11%), and Immigrants from Mexico (95.1%, a difference of 0.14%).
| Demographics | Rating | Rank | 4th Grade |
| Immigrants | Dominican Republic | 0.0 /100 | #333 | Tragic 95.7% |
| Immigrants | Cabo Verde | 0.0 /100 | #334 | Tragic 95.7% |
| Immigrants | Latin America | 0.0 /100 | #335 | Tragic 95.7% |
| Mexicans | 0.0 /100 | #336 | Tragic 95.6% |
| Central Americans | 0.0 /100 | #337 | Tragic 95.5% |
| Nepalese | 0.0 /100 | #338 | Tragic 95.5% |
| Guatemalans | 0.0 /100 | #339 | Tragic 95.3% |
| Yakama | 0.0 /100 | #340 | Tragic 95.2% |
| Immigrants | Yemen | 0.0 /100 | #341 | Tragic 95.2% |
| Immigrants | Central America | 0.0 /100 | #342 | Tragic 95.1% |
| Immigrants | Guatemala | 0.0 /100 | #343 | Tragic 95.1% |
| Immigrants | Mexico | 0.0 /100 | #344 | Tragic 95.1% |
| Salvadorans | 0.0 /100 | #345 | Tragic 95.0% |
| Immigrants | El Salvador | 0.0 /100 | #346 | Tragic 94.8% |
| Spanish American Indians | 0.0 /100 | #347 | Tragic 94.6% |