Mexican vs Immigrants from Micronesia Bachelor's Degree
COMPARE
Mexican
Immigrants from Micronesia
Bachelor's Degree
Bachelor's Degree Comparison
Mexicans
Immigrants from Micronesia
27.1%
BACHELOR'S DEGREE
0.0/ 100
METRIC RATING
333rd/ 347
METRIC RANK
30.4%
BACHELOR'S DEGREE
0.0/ 100
METRIC RATING
300th/ 347
METRIC RANK
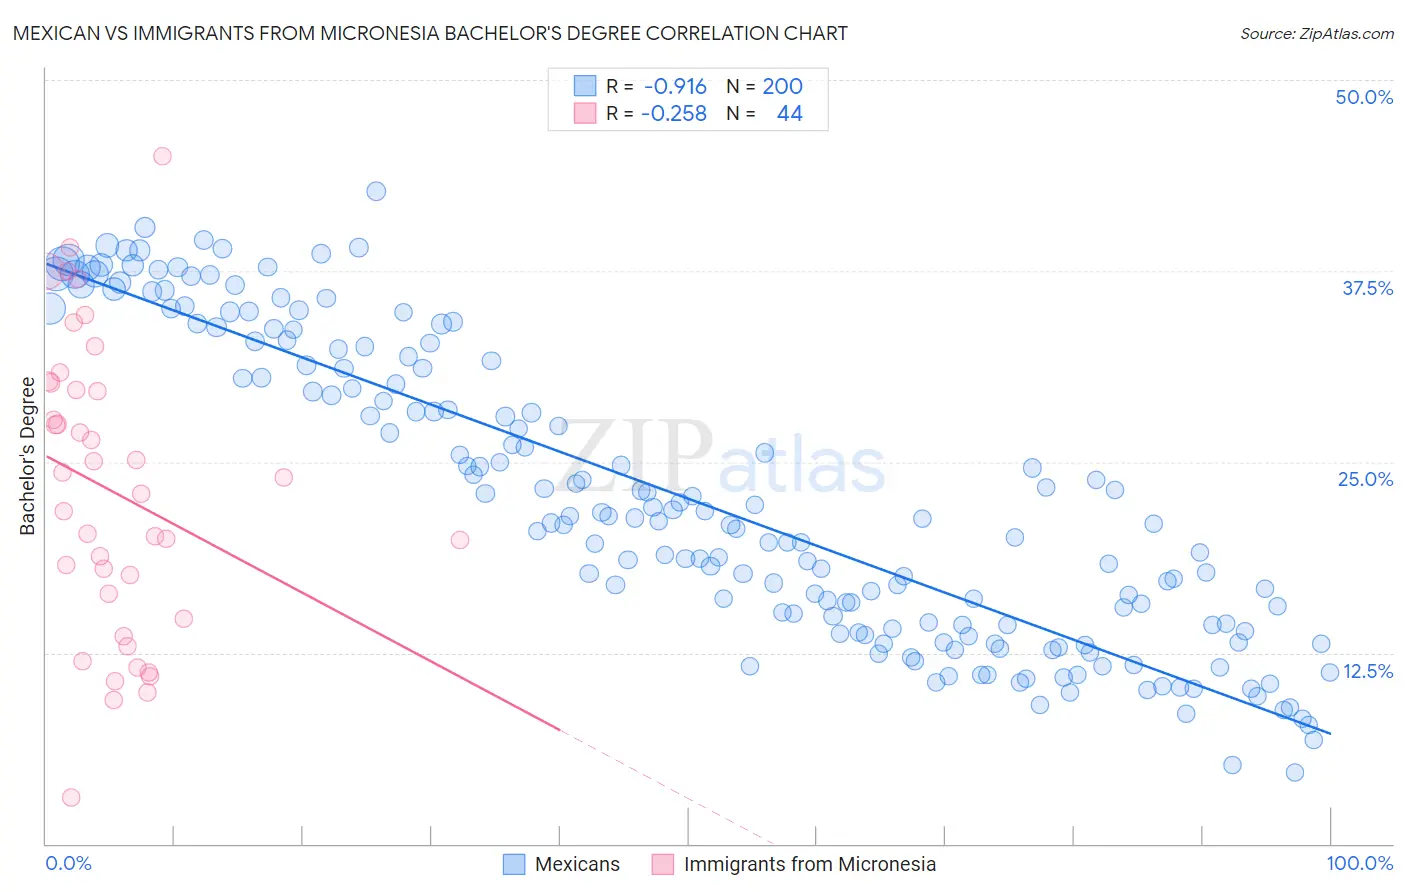
Mexican vs Immigrants from Micronesia Bachelor's Degree Correlation Chart
The statistical analysis conducted on geographies consisting of 565,096,566 people shows a near-perfect negative correlation between the proportion of Mexicans and percentage of population with at least bachelor's degree education in the United States with a correlation coefficient (R) of -0.916 and weighted average of 27.1%. Similarly, the statistical analysis conducted on geographies consisting of 61,608,325 people shows a weak negative correlation between the proportion of Immigrants from Micronesia and percentage of population with at least bachelor's degree education in the United States with a correlation coefficient (R) of -0.258 and weighted average of 30.4%, a difference of 12.3%.
Bachelor's Degree Correlation Summary
| Measurement | Mexican | Immigrants from Micronesia |
| Minimum | 4.7% | 3.0% |
| Maximum | 42.7% | 45.0% |
| Range | 38.0% | 42.0% |
| Mean | 22.6% | 23.1% |
| Median | 21.0% | 23.5% |
| Interquartile 25% (IQ1) | 14.2% | 15.6% |
| Interquartile 75% (IQ3) | 31.5% | 29.9% |
| Interquartile Range (IQR) | 17.2% | 14.4% |
| Standard Deviation (Sample) | 9.7% | 9.6% |
| Standard Deviation (Population) | 9.7% | 9.5% |
Similar Demographics by Bachelor's Degree
Demographics Similar to Mexicans by Bachelor's Degree
In terms of bachelor's degree, the demographic groups most similar to Mexicans are Menominee (27.3%, a difference of 0.82%), Immigrants from the Azores (27.3%, a difference of 0.92%), Spanish American Indian (27.5%, a difference of 1.4%), Immigrants from Central America (27.5%, a difference of 1.5%), and Arapaho (26.6%, a difference of 1.7%).
| Demographics | Rating | Rank | Bachelor's Degree |
| Apache | 0.0 /100 | #326 | Tragic 28.3% |
| Paiute | 0.0 /100 | #327 | Tragic 28.1% |
| Crow | 0.0 /100 | #328 | Tragic 27.7% |
| Immigrants | Central America | 0.0 /100 | #329 | Tragic 27.5% |
| Spanish American Indians | 0.0 /100 | #330 | Tragic 27.5% |
| Immigrants | Azores | 0.0 /100 | #331 | Tragic 27.3% |
| Menominee | 0.0 /100 | #332 | Tragic 27.3% |
| Mexicans | 0.0 /100 | #333 | Tragic 27.1% |
| Arapaho | 0.0 /100 | #334 | Tragic 26.6% |
| Natives/Alaskans | 0.0 /100 | #335 | Tragic 26.3% |
| Immigrants | Mexico | 0.0 /100 | #336 | Tragic 26.1% |
| Inupiat | 0.0 /100 | #337 | Tragic 25.8% |
| Pueblo | 0.0 /100 | #338 | Tragic 25.5% |
| Hopi | 0.0 /100 | #339 | Tragic 25.3% |
| Lumbee | 0.0 /100 | #340 | Tragic 24.8% |
Demographics Similar to Immigrants from Micronesia by Bachelor's Degree
In terms of bachelor's degree, the demographic groups most similar to Immigrants from Micronesia are Chickasaw (30.4%, a difference of 0.020%), Immigrants from Cuba (30.3%, a difference of 0.22%), Mexican American Indian (30.2%, a difference of 0.49%), Chippewa (30.6%, a difference of 0.54%), and Bangladeshi (30.2%, a difference of 0.66%).
| Demographics | Rating | Rank | Bachelor's Degree |
| Cape Verdeans | 0.1 /100 | #293 | Tragic 30.9% |
| Immigrants | Guatemala | 0.0 /100 | #294 | Tragic 30.8% |
| Immigrants | Dominican Republic | 0.0 /100 | #295 | Tragic 30.7% |
| Puget Sound Salish | 0.0 /100 | #296 | Tragic 30.7% |
| Immigrants | Haiti | 0.0 /100 | #297 | Tragic 30.6% |
| Chippewa | 0.0 /100 | #298 | Tragic 30.6% |
| Chickasaw | 0.0 /100 | #299 | Tragic 30.4% |
| Immigrants | Micronesia | 0.0 /100 | #300 | Tragic 30.4% |
| Immigrants | Cuba | 0.0 /100 | #301 | Tragic 30.3% |
| Mexican American Indians | 0.0 /100 | #302 | Tragic 30.2% |
| Bangladeshis | 0.0 /100 | #303 | Tragic 30.2% |
| Cherokee | 0.0 /100 | #304 | Tragic 30.2% |
| Immigrants | Latin America | 0.0 /100 | #305 | Tragic 30.1% |
| Immigrants | Yemen | 0.0 /100 | #306 | Tragic 29.9% |
| Nepalese | 0.0 /100 | #307 | Tragic 29.9% |