Scotch-Irish vs Immigrants from Micronesia Bachelor's Degree
COMPARE
Scotch-Irish
Immigrants from Micronesia
Bachelor's Degree
Bachelor's Degree Comparison
Scotch-Irish
Immigrants from Micronesia
36.4%
BACHELOR'S DEGREE
18.3/ 100
METRIC RATING
211th/ 347
METRIC RANK
30.4%
BACHELOR'S DEGREE
0.0/ 100
METRIC RATING
300th/ 347
METRIC RANK
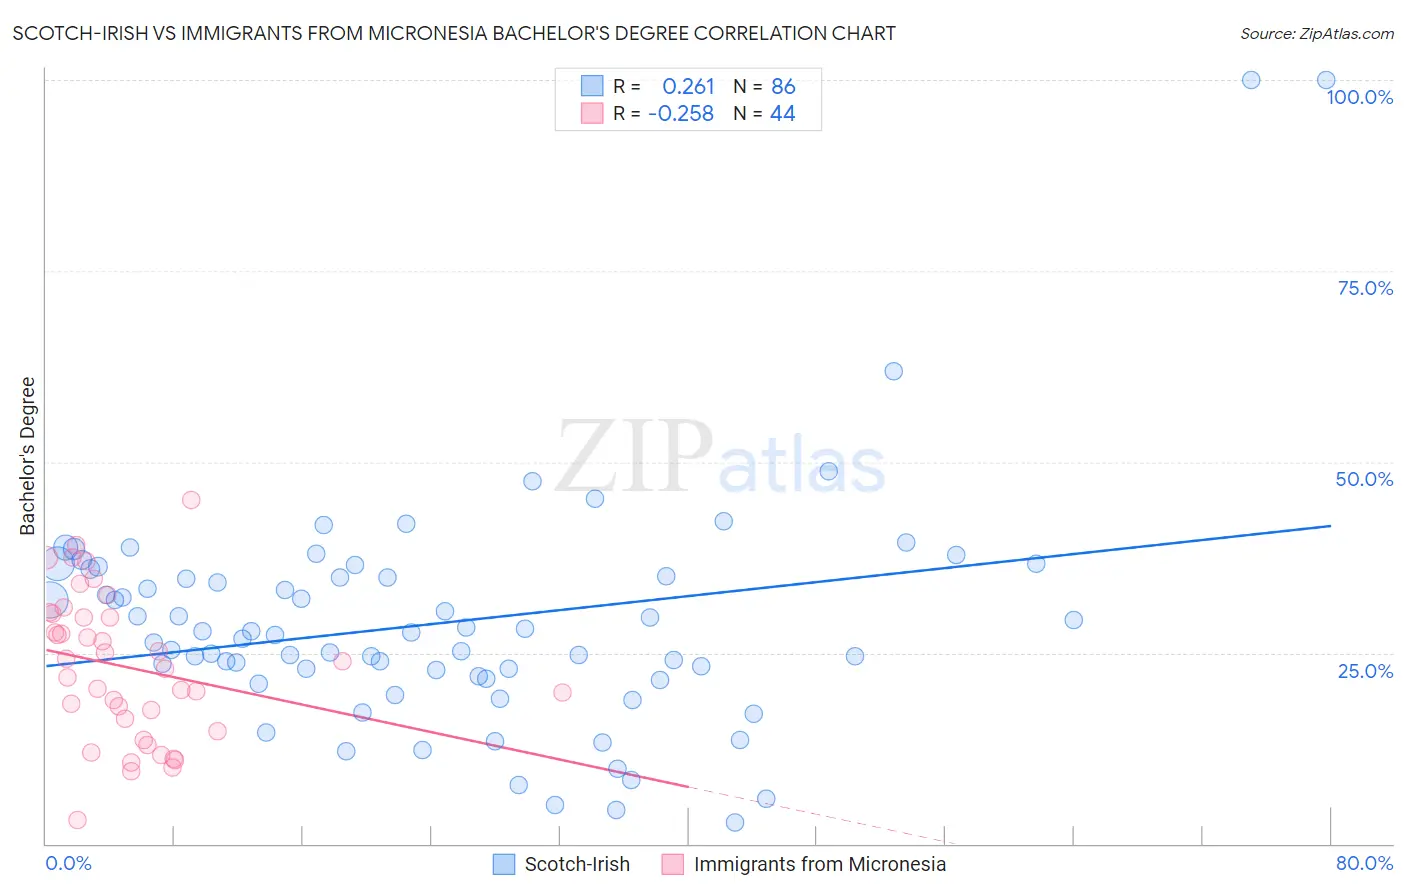
Scotch-Irish vs Immigrants from Micronesia Bachelor's Degree Correlation Chart
The statistical analysis conducted on geographies consisting of 548,685,901 people shows a weak positive correlation between the proportion of Scotch-Irish and percentage of population with at least bachelor's degree education in the United States with a correlation coefficient (R) of 0.261 and weighted average of 36.4%. Similarly, the statistical analysis conducted on geographies consisting of 61,608,325 people shows a weak negative correlation between the proportion of Immigrants from Micronesia and percentage of population with at least bachelor's degree education in the United States with a correlation coefficient (R) of -0.258 and weighted average of 30.4%, a difference of 19.9%.
Bachelor's Degree Correlation Summary
| Measurement | Scotch-Irish | Immigrants from Micronesia |
| Minimum | 2.9% | 3.0% |
| Maximum | 100.0% | 45.0% |
| Range | 97.1% | 42.0% |
| Mean | 28.9% | 23.1% |
| Median | 27.5% | 23.5% |
| Interquartile 25% (IQ1) | 21.9% | 15.6% |
| Interquartile 75% (IQ3) | 35.1% | 29.9% |
| Interquartile Range (IQR) | 13.2% | 14.4% |
| Standard Deviation (Sample) | 15.4% | 9.6% |
| Standard Deviation (Population) | 15.3% | 9.5% |
Similar Demographics by Bachelor's Degree
Demographics Similar to Scotch-Irish by Bachelor's Degree
In terms of bachelor's degree, the demographic groups most similar to Scotch-Irish are French (36.5%, a difference of 0.050%), Panamanian (36.5%, a difference of 0.080%), Immigrants from Philippines (36.4%, a difference of 0.080%), Immigrants from Thailand (36.5%, a difference of 0.18%), and Immigrants from Middle Africa (36.6%, a difference of 0.38%).
| Demographics | Rating | Rank | Bachelor's Degree |
| Immigrants | Immigrants | 22.8 /100 | #204 | Fair 36.7% |
| Finns | 22.2 /100 | #205 | Fair 36.7% |
| Spaniards | 21.2 /100 | #206 | Fair 36.6% |
| Immigrants | Middle Africa | 20.6 /100 | #207 | Fair 36.6% |
| Immigrants | Thailand | 19.4 /100 | #208 | Poor 36.5% |
| Panamanians | 18.8 /100 | #209 | Poor 36.5% |
| French | 18.6 /100 | #210 | Poor 36.5% |
| Scotch-Irish | 18.3 /100 | #211 | Poor 36.4% |
| Immigrants | Philippines | 17.8 /100 | #212 | Poor 36.4% |
| Immigrants | Panama | 14.2 /100 | #213 | Poor 36.2% |
| Germans | 13.9 /100 | #214 | Poor 36.1% |
| Immigrants | Western Africa | 13.8 /100 | #215 | Poor 36.1% |
| Barbadians | 13.5 /100 | #216 | Poor 36.1% |
| German Russians | 10.2 /100 | #217 | Poor 35.8% |
| Sub-Saharan Africans | 9.8 /100 | #218 | Tragic 35.8% |
Demographics Similar to Immigrants from Micronesia by Bachelor's Degree
In terms of bachelor's degree, the demographic groups most similar to Immigrants from Micronesia are Chickasaw (30.4%, a difference of 0.020%), Immigrants from Cuba (30.3%, a difference of 0.22%), Mexican American Indian (30.2%, a difference of 0.49%), Chippewa (30.6%, a difference of 0.54%), and Bangladeshi (30.2%, a difference of 0.66%).
| Demographics | Rating | Rank | Bachelor's Degree |
| Cape Verdeans | 0.1 /100 | #293 | Tragic 30.9% |
| Immigrants | Guatemala | 0.0 /100 | #294 | Tragic 30.8% |
| Immigrants | Dominican Republic | 0.0 /100 | #295 | Tragic 30.7% |
| Puget Sound Salish | 0.0 /100 | #296 | Tragic 30.7% |
| Immigrants | Haiti | 0.0 /100 | #297 | Tragic 30.6% |
| Chippewa | 0.0 /100 | #298 | Tragic 30.6% |
| Chickasaw | 0.0 /100 | #299 | Tragic 30.4% |
| Immigrants | Micronesia | 0.0 /100 | #300 | Tragic 30.4% |
| Immigrants | Cuba | 0.0 /100 | #301 | Tragic 30.3% |
| Mexican American Indians | 0.0 /100 | #302 | Tragic 30.2% |
| Bangladeshis | 0.0 /100 | #303 | Tragic 30.2% |
| Cherokee | 0.0 /100 | #304 | Tragic 30.2% |
| Immigrants | Latin America | 0.0 /100 | #305 | Tragic 30.1% |
| Immigrants | Yemen | 0.0 /100 | #306 | Tragic 29.9% |
| Nepalese | 0.0 /100 | #307 | Tragic 29.9% |