Native Hawaiian vs Immigrants from Micronesia Bachelor's Degree
COMPARE
Native Hawaiian
Immigrants from Micronesia
Bachelor's Degree
Bachelor's Degree Comparison
Native Hawaiians
Immigrants from Micronesia
33.2%
BACHELOR'S DEGREE
0.7/ 100
METRIC RATING
254th/ 347
METRIC RANK
30.4%
BACHELOR'S DEGREE
0.0/ 100
METRIC RATING
300th/ 347
METRIC RANK
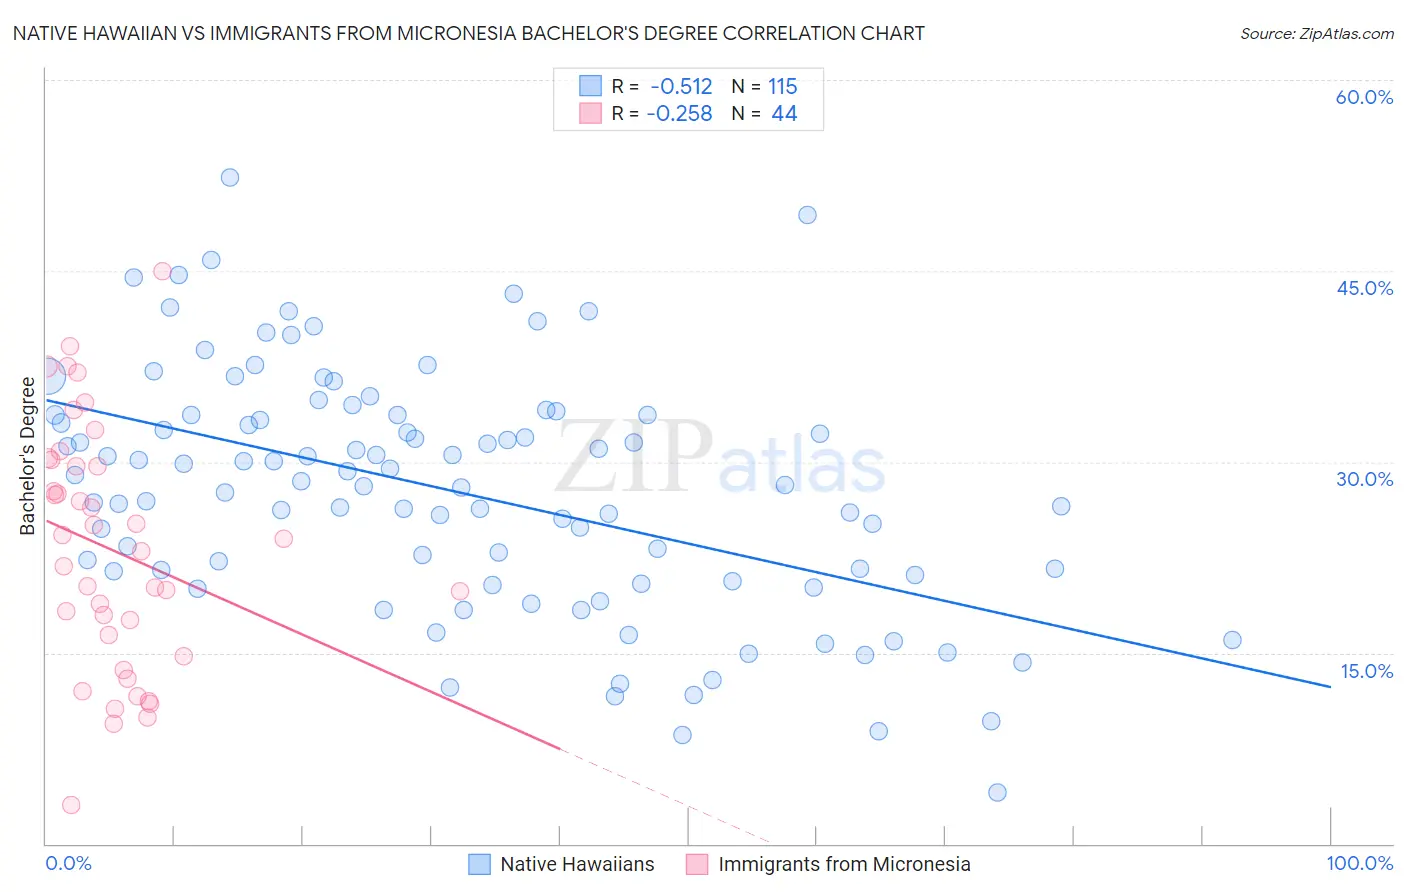
Native Hawaiian vs Immigrants from Micronesia Bachelor's Degree Correlation Chart
The statistical analysis conducted on geographies consisting of 332,091,621 people shows a substantial negative correlation between the proportion of Native Hawaiians and percentage of population with at least bachelor's degree education in the United States with a correlation coefficient (R) of -0.512 and weighted average of 33.2%. Similarly, the statistical analysis conducted on geographies consisting of 61,608,325 people shows a weak negative correlation between the proportion of Immigrants from Micronesia and percentage of population with at least bachelor's degree education in the United States with a correlation coefficient (R) of -0.258 and weighted average of 30.4%, a difference of 9.3%.
Bachelor's Degree Correlation Summary
| Measurement | Native Hawaiian | Immigrants from Micronesia |
| Minimum | 4.0% | 3.0% |
| Maximum | 52.3% | 45.0% |
| Range | 48.3% | 42.0% |
| Mean | 27.7% | 23.1% |
| Median | 28.2% | 23.5% |
| Interquartile 25% (IQ1) | 21.1% | 15.6% |
| Interquartile 75% (IQ3) | 33.6% | 29.9% |
| Interquartile Range (IQR) | 12.5% | 14.4% |
| Standard Deviation (Sample) | 9.4% | 9.6% |
| Standard Deviation (Population) | 9.4% | 9.5% |
Similar Demographics by Bachelor's Degree
Demographics Similar to Native Hawaiians by Bachelor's Degree
In terms of bachelor's degree, the demographic groups most similar to Native Hawaiians are Iroquois (33.2%, a difference of 0.020%), U.S. Virgin Islander (33.2%, a difference of 0.060%), Nicaraguan (33.1%, a difference of 0.20%), Immigrants from Bahamas (33.3%, a difference of 0.27%), and Japanese (33.3%, a difference of 0.34%).
| Demographics | Rating | Rank | Bachelor's Degree |
| Immigrants | Congo | 1.0 /100 | #247 | Tragic 33.6% |
| Cree | 1.0 /100 | #248 | Tragic 33.6% |
| Immigrants | Liberia | 0.9 /100 | #249 | Tragic 33.5% |
| Indonesians | 0.9 /100 | #250 | Tragic 33.5% |
| Japanese | 0.7 /100 | #251 | Tragic 33.3% |
| Immigrants | Bahamas | 0.7 /100 | #252 | Tragic 33.3% |
| U.S. Virgin Islanders | 0.7 /100 | #253 | Tragic 33.2% |
| Native Hawaiians | 0.7 /100 | #254 | Tragic 33.2% |
| Iroquois | 0.7 /100 | #255 | Tragic 33.2% |
| Nicaraguans | 0.6 /100 | #256 | Tragic 33.1% |
| Spanish Americans | 0.6 /100 | #257 | Tragic 33.1% |
| French American Indians | 0.6 /100 | #258 | Tragic 33.1% |
| Osage | 0.5 /100 | #259 | Tragic 33.0% |
| Malaysians | 0.5 /100 | #260 | Tragic 32.9% |
| Africans | 0.5 /100 | #261 | Tragic 32.9% |
Demographics Similar to Immigrants from Micronesia by Bachelor's Degree
In terms of bachelor's degree, the demographic groups most similar to Immigrants from Micronesia are Chickasaw (30.4%, a difference of 0.020%), Immigrants from Cuba (30.3%, a difference of 0.22%), Mexican American Indian (30.2%, a difference of 0.49%), Chippewa (30.6%, a difference of 0.54%), and Bangladeshi (30.2%, a difference of 0.66%).
| Demographics | Rating | Rank | Bachelor's Degree |
| Cape Verdeans | 0.1 /100 | #293 | Tragic 30.9% |
| Immigrants | Guatemala | 0.0 /100 | #294 | Tragic 30.8% |
| Immigrants | Dominican Republic | 0.0 /100 | #295 | Tragic 30.7% |
| Puget Sound Salish | 0.0 /100 | #296 | Tragic 30.7% |
| Immigrants | Haiti | 0.0 /100 | #297 | Tragic 30.6% |
| Chippewa | 0.0 /100 | #298 | Tragic 30.6% |
| Chickasaw | 0.0 /100 | #299 | Tragic 30.4% |
| Immigrants | Micronesia | 0.0 /100 | #300 | Tragic 30.4% |
| Immigrants | Cuba | 0.0 /100 | #301 | Tragic 30.3% |
| Mexican American Indians | 0.0 /100 | #302 | Tragic 30.2% |
| Bangladeshis | 0.0 /100 | #303 | Tragic 30.2% |
| Cherokee | 0.0 /100 | #304 | Tragic 30.2% |
| Immigrants | Latin America | 0.0 /100 | #305 | Tragic 30.1% |
| Immigrants | Yemen | 0.0 /100 | #306 | Tragic 29.9% |
| Nepalese | 0.0 /100 | #307 | Tragic 29.9% |