Polish vs Immigrants from Micronesia Bachelor's Degree
COMPARE
Polish
Immigrants from Micronesia
Bachelor's Degree
Bachelor's Degree Comparison
Poles
Immigrants from Micronesia
39.1%
BACHELOR'S DEGREE
79.8/ 100
METRIC RATING
143rd/ 347
METRIC RANK
30.4%
BACHELOR'S DEGREE
0.0/ 100
METRIC RATING
300th/ 347
METRIC RANK
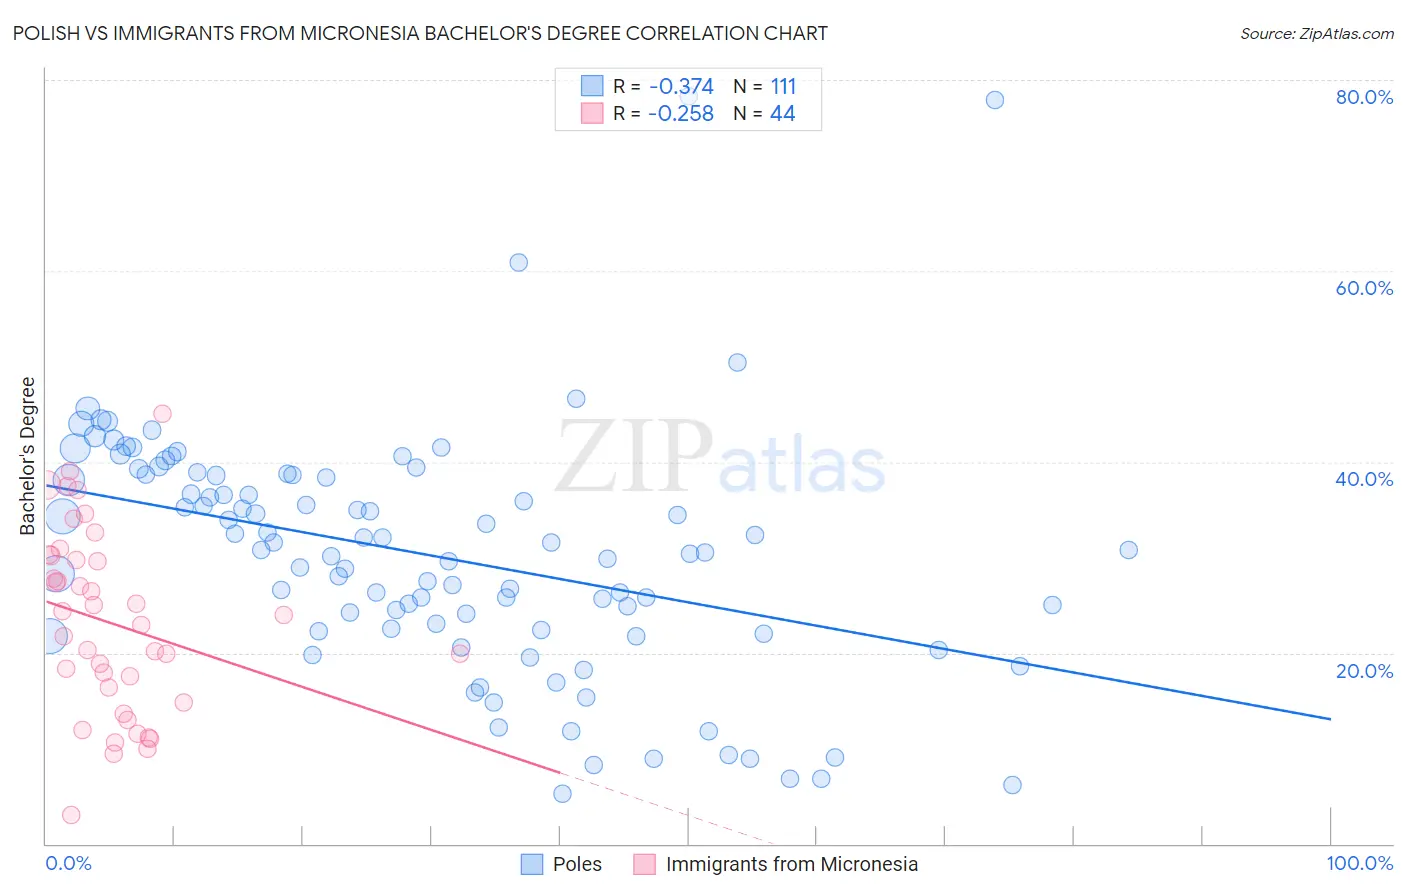
Polish vs Immigrants from Micronesia Bachelor's Degree Correlation Chart
The statistical analysis conducted on geographies consisting of 560,456,135 people shows a mild negative correlation between the proportion of Poles and percentage of population with at least bachelor's degree education in the United States with a correlation coefficient (R) of -0.374 and weighted average of 39.1%. Similarly, the statistical analysis conducted on geographies consisting of 61,608,325 people shows a weak negative correlation between the proportion of Immigrants from Micronesia and percentage of population with at least bachelor's degree education in the United States with a correlation coefficient (R) of -0.258 and weighted average of 30.4%, a difference of 28.6%.
Bachelor's Degree Correlation Summary
| Measurement | Polish | Immigrants from Micronesia |
| Minimum | 5.2% | 3.0% |
| Maximum | 78.3% | 45.0% |
| Range | 73.0% | 42.0% |
| Mean | 30.3% | 23.1% |
| Median | 30.7% | 23.5% |
| Interquartile 25% (IQ1) | 22.4% | 15.6% |
| Interquartile 75% (IQ3) | 38.7% | 29.9% |
| Interquartile Range (IQR) | 16.3% | 14.4% |
| Standard Deviation (Sample) | 12.7% | 9.6% |
| Standard Deviation (Population) | 12.7% | 9.5% |
Similar Demographics by Bachelor's Degree
Demographics Similar to Poles by Bachelor's Degree
In terms of bachelor's degree, the demographic groups most similar to Poles are Immigrants from Afghanistan (39.1%, a difference of 0.020%), Slovene (39.1%, a difference of 0.050%), Swedish (39.1%, a difference of 0.090%), Immigrants from Sierra Leone (39.0%, a difference of 0.12%), and Iraqi (39.0%, a difference of 0.25%).
| Demographics | Rating | Rank | Bachelor's Degree |
| Pakistanis | 88.2 /100 | #136 | Excellent 39.7% |
| Icelanders | 86.5 /100 | #137 | Excellent 39.5% |
| Europeans | 85.6 /100 | #138 | Excellent 39.5% |
| Immigrants | Sudan | 84.5 /100 | #139 | Excellent 39.4% |
| Immigrants | Armenia | 84.1 /100 | #140 | Excellent 39.4% |
| South American Indians | 83.6 /100 | #141 | Excellent 39.3% |
| Immigrants | North Macedonia | 81.6 /100 | #142 | Excellent 39.2% |
| Poles | 79.8 /100 | #143 | Good 39.1% |
| Immigrants | Afghanistan | 79.7 /100 | #144 | Good 39.1% |
| Slovenes | 79.5 /100 | #145 | Good 39.1% |
| Swedes | 79.2 /100 | #146 | Good 39.1% |
| Immigrants | Sierra Leone | 79.0 /100 | #147 | Good 39.0% |
| Iraqis | 78.1 /100 | #148 | Good 39.0% |
| Immigrants | Poland | 77.5 /100 | #149 | Good 39.0% |
| South Americans | 77.3 /100 | #150 | Good 38.9% |
Demographics Similar to Immigrants from Micronesia by Bachelor's Degree
In terms of bachelor's degree, the demographic groups most similar to Immigrants from Micronesia are Chickasaw (30.4%, a difference of 0.020%), Immigrants from Cuba (30.3%, a difference of 0.22%), Mexican American Indian (30.2%, a difference of 0.49%), Chippewa (30.6%, a difference of 0.54%), and Bangladeshi (30.2%, a difference of 0.66%).
| Demographics | Rating | Rank | Bachelor's Degree |
| Cape Verdeans | 0.1 /100 | #293 | Tragic 30.9% |
| Immigrants | Guatemala | 0.0 /100 | #294 | Tragic 30.8% |
| Immigrants | Dominican Republic | 0.0 /100 | #295 | Tragic 30.7% |
| Puget Sound Salish | 0.0 /100 | #296 | Tragic 30.7% |
| Immigrants | Haiti | 0.0 /100 | #297 | Tragic 30.6% |
| Chippewa | 0.0 /100 | #298 | Tragic 30.6% |
| Chickasaw | 0.0 /100 | #299 | Tragic 30.4% |
| Immigrants | Micronesia | 0.0 /100 | #300 | Tragic 30.4% |
| Immigrants | Cuba | 0.0 /100 | #301 | Tragic 30.3% |
| Mexican American Indians | 0.0 /100 | #302 | Tragic 30.2% |
| Bangladeshis | 0.0 /100 | #303 | Tragic 30.2% |
| Cherokee | 0.0 /100 | #304 | Tragic 30.2% |
| Immigrants | Latin America | 0.0 /100 | #305 | Tragic 30.1% |
| Immigrants | Yemen | 0.0 /100 | #306 | Tragic 29.9% |
| Nepalese | 0.0 /100 | #307 | Tragic 29.9% |