Mexican vs Cree Bachelor's Degree
COMPARE
Mexican
Cree
Bachelor's Degree
Bachelor's Degree Comparison
Mexicans
Cree
27.1%
BACHELOR'S DEGREE
0.0/ 100
METRIC RATING
333rd/ 347
METRIC RANK
33.6%
BACHELOR'S DEGREE
1.0/ 100
METRIC RATING
248th/ 347
METRIC RANK
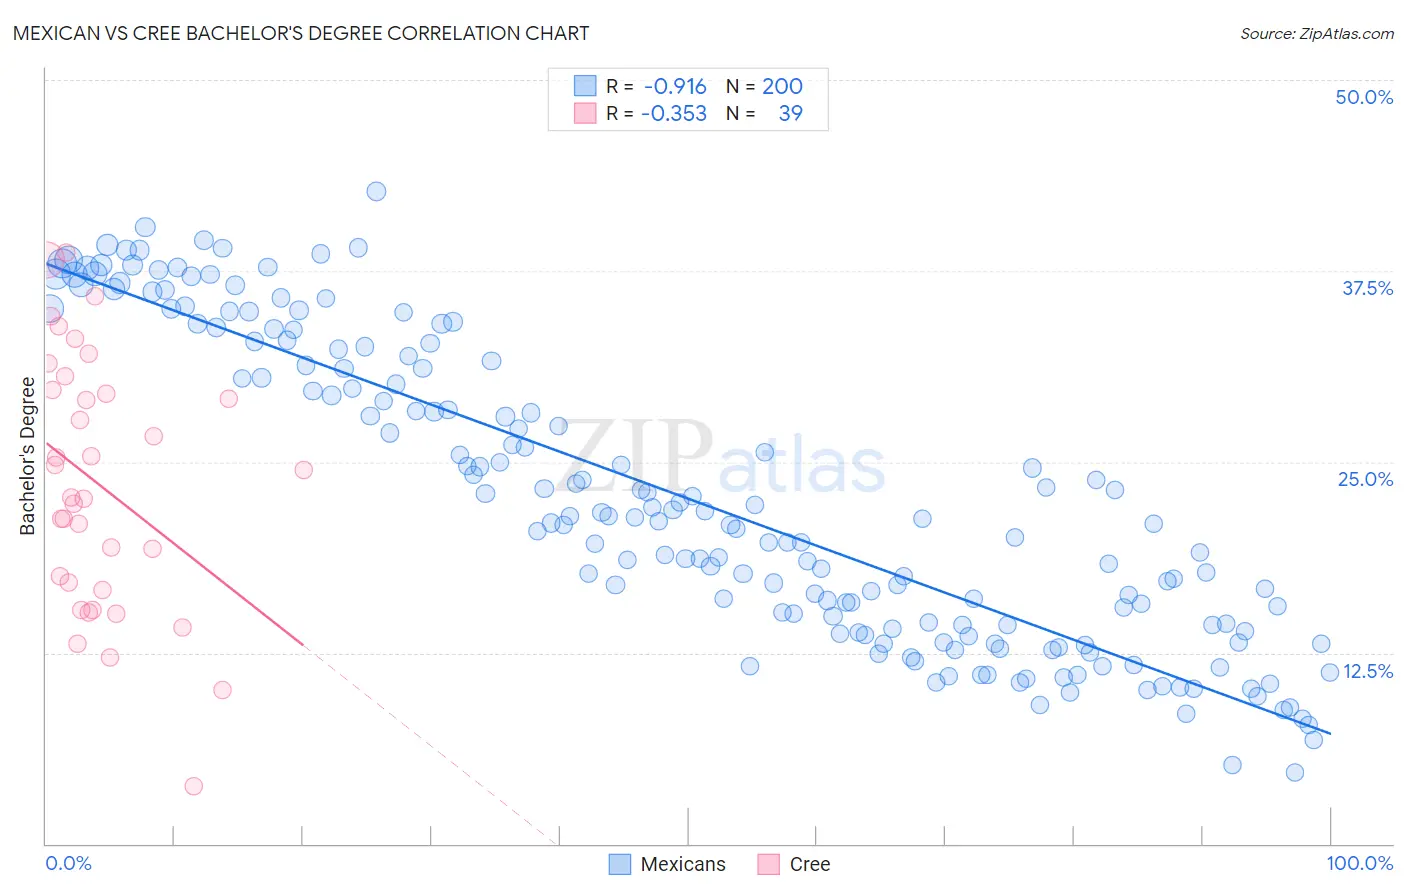
Mexican vs Cree Bachelor's Degree Correlation Chart
The statistical analysis conducted on geographies consisting of 565,096,566 people shows a near-perfect negative correlation between the proportion of Mexicans and percentage of population with at least bachelor's degree education in the United States with a correlation coefficient (R) of -0.916 and weighted average of 27.1%. Similarly, the statistical analysis conducted on geographies consisting of 76,210,625 people shows a mild negative correlation between the proportion of Cree and percentage of population with at least bachelor's degree education in the United States with a correlation coefficient (R) of -0.353 and weighted average of 33.6%, a difference of 24.0%.
Bachelor's Degree Correlation Summary
| Measurement | Mexican | Cree |
| Minimum | 4.7% | 3.8% |
| Maximum | 42.7% | 38.7% |
| Range | 38.0% | 34.9% |
| Mean | 22.6% | 23.5% |
| Median | 21.0% | 22.6% |
| Interquartile 25% (IQ1) | 14.2% | 16.6% |
| Interquartile 75% (IQ3) | 31.5% | 29.7% |
| Interquartile Range (IQR) | 17.2% | 13.1% |
| Standard Deviation (Sample) | 9.7% | 8.3% |
| Standard Deviation (Population) | 9.7% | 8.2% |
Similar Demographics by Bachelor's Degree
Demographics Similar to Mexicans by Bachelor's Degree
In terms of bachelor's degree, the demographic groups most similar to Mexicans are Menominee (27.3%, a difference of 0.82%), Immigrants from the Azores (27.3%, a difference of 0.92%), Spanish American Indian (27.5%, a difference of 1.4%), Immigrants from Central America (27.5%, a difference of 1.5%), and Arapaho (26.6%, a difference of 1.7%).
| Demographics | Rating | Rank | Bachelor's Degree |
| Apache | 0.0 /100 | #326 | Tragic 28.3% |
| Paiute | 0.0 /100 | #327 | Tragic 28.1% |
| Crow | 0.0 /100 | #328 | Tragic 27.7% |
| Immigrants | Central America | 0.0 /100 | #329 | Tragic 27.5% |
| Spanish American Indians | 0.0 /100 | #330 | Tragic 27.5% |
| Immigrants | Azores | 0.0 /100 | #331 | Tragic 27.3% |
| Menominee | 0.0 /100 | #332 | Tragic 27.3% |
| Mexicans | 0.0 /100 | #333 | Tragic 27.1% |
| Arapaho | 0.0 /100 | #334 | Tragic 26.6% |
| Natives/Alaskans | 0.0 /100 | #335 | Tragic 26.3% |
| Immigrants | Mexico | 0.0 /100 | #336 | Tragic 26.1% |
| Inupiat | 0.0 /100 | #337 | Tragic 25.8% |
| Pueblo | 0.0 /100 | #338 | Tragic 25.5% |
| Hopi | 0.0 /100 | #339 | Tragic 25.3% |
| Lumbee | 0.0 /100 | #340 | Tragic 24.8% |
Demographics Similar to Cree by Bachelor's Degree
In terms of bachelor's degree, the demographic groups most similar to Cree are Immigrants from Congo (33.6%, a difference of 0.010%), Jamaican (33.6%, a difference of 0.10%), Immigrants from Liberia (33.5%, a difference of 0.13%), Indonesian (33.5%, a difference of 0.13%), and Immigrants from Fiji (33.7%, a difference of 0.47%).
| Demographics | Rating | Rank | Bachelor's Degree |
| Immigrants | Cambodia | 1.9 /100 | #241 | Tragic 34.2% |
| Immigrants | Nonimmigrants | 1.8 /100 | #242 | Tragic 34.2% |
| Immigrants | Guyana | 1.4 /100 | #243 | Tragic 33.9% |
| Delaware | 1.2 /100 | #244 | Tragic 33.8% |
| Immigrants | Fiji | 1.2 /100 | #245 | Tragic 33.7% |
| Jamaicans | 1.0 /100 | #246 | Tragic 33.6% |
| Immigrants | Congo | 1.0 /100 | #247 | Tragic 33.6% |
| Cree | 1.0 /100 | #248 | Tragic 33.6% |
| Immigrants | Liberia | 0.9 /100 | #249 | Tragic 33.5% |
| Indonesians | 0.9 /100 | #250 | Tragic 33.5% |
| Japanese | 0.7 /100 | #251 | Tragic 33.3% |
| Immigrants | Bahamas | 0.7 /100 | #252 | Tragic 33.3% |
| U.S. Virgin Islanders | 0.7 /100 | #253 | Tragic 33.2% |
| Native Hawaiians | 0.7 /100 | #254 | Tragic 33.2% |
| Iroquois | 0.7 /100 | #255 | Tragic 33.2% |