Afghan vs Immigrants from Micronesia Bachelor's Degree
COMPARE
Afghan
Immigrants from Micronesia
Bachelor's Degree
Bachelor's Degree Comparison
Afghans
Immigrants from Micronesia
40.8%
BACHELOR'S DEGREE
96.2/ 100
METRIC RATING
114th/ 347
METRIC RANK
30.4%
BACHELOR'S DEGREE
0.0/ 100
METRIC RATING
300th/ 347
METRIC RANK
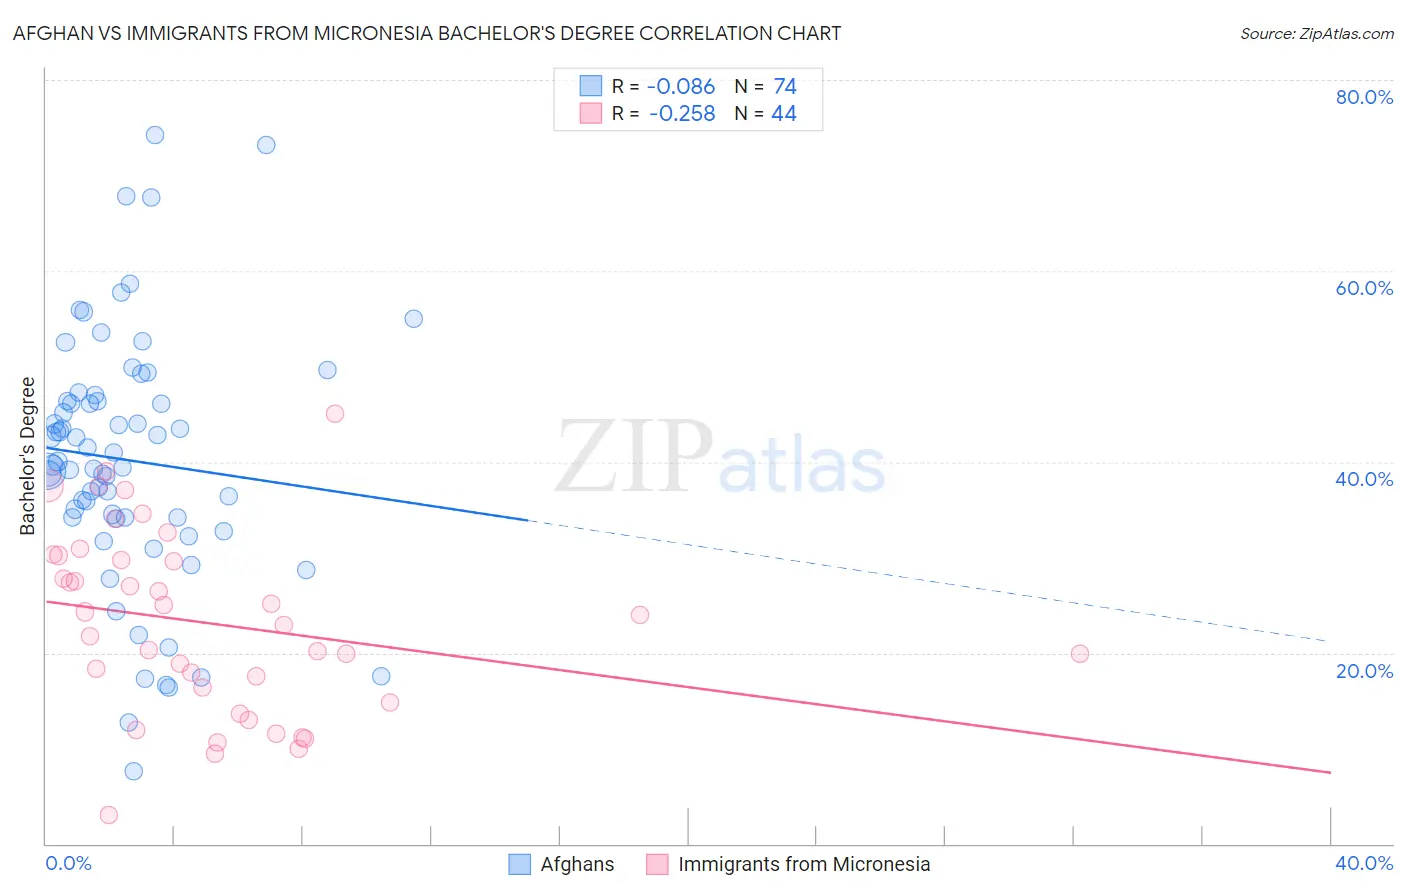
Afghan vs Immigrants from Micronesia Bachelor's Degree Correlation Chart
The statistical analysis conducted on geographies consisting of 148,869,794 people shows a slight negative correlation between the proportion of Afghans and percentage of population with at least bachelor's degree education in the United States with a correlation coefficient (R) of -0.086 and weighted average of 40.8%. Similarly, the statistical analysis conducted on geographies consisting of 61,608,325 people shows a weak negative correlation between the proportion of Immigrants from Micronesia and percentage of population with at least bachelor's degree education in the United States with a correlation coefficient (R) of -0.258 and weighted average of 30.4%, a difference of 34.3%.
Bachelor's Degree Correlation Summary
| Measurement | Afghan | Immigrants from Micronesia |
| Minimum | 7.6% | 3.0% |
| Maximum | 74.2% | 45.0% |
| Range | 66.6% | 42.0% |
| Mean | 40.2% | 23.1% |
| Median | 39.8% | 23.5% |
| Interquartile 25% (IQ1) | 34.1% | 15.6% |
| Interquartile 75% (IQ3) | 46.4% | 29.9% |
| Interquartile Range (IQR) | 12.3% | 14.4% |
| Standard Deviation (Sample) | 13.3% | 9.6% |
| Standard Deviation (Population) | 13.2% | 9.5% |
Similar Demographics by Bachelor's Degree
Demographics Similar to Afghans by Bachelor's Degree
In terms of bachelor's degree, the demographic groups most similar to Afghans are Brazilian (40.8%, a difference of 0.030%), Ugandan (40.8%, a difference of 0.070%), Immigrants from Chile (40.8%, a difference of 0.12%), Albanian (40.9%, a difference of 0.16%), and Arab (40.9%, a difference of 0.24%).
| Demographics | Rating | Rank | Bachelor's Degree |
| Northern Europeans | 96.8 /100 | #107 | Exceptional 41.0% |
| Ukrainians | 96.6 /100 | #108 | Exceptional 40.9% |
| Arabs | 96.6 /100 | #109 | Exceptional 40.9% |
| Albanians | 96.5 /100 | #110 | Exceptional 40.9% |
| Immigrants | Chile | 96.4 /100 | #111 | Exceptional 40.8% |
| Ugandans | 96.3 /100 | #112 | Exceptional 40.8% |
| Brazilians | 96.3 /100 | #113 | Exceptional 40.8% |
| Afghans | 96.2 /100 | #114 | Exceptional 40.8% |
| Palestinians | 95.8 /100 | #115 | Exceptional 40.7% |
| Immigrants | Uganda | 95.7 /100 | #116 | Exceptional 40.7% |
| Austrians | 95.5 /100 | #117 | Exceptional 40.6% |
| Croatians | 95.5 /100 | #118 | Exceptional 40.6% |
| Immigrants | Syria | 94.9 /100 | #119 | Exceptional 40.5% |
| Venezuelans | 94.7 /100 | #120 | Exceptional 40.5% |
| Moroccans | 94.6 /100 | #121 | Exceptional 40.5% |
Demographics Similar to Immigrants from Micronesia by Bachelor's Degree
In terms of bachelor's degree, the demographic groups most similar to Immigrants from Micronesia are Chickasaw (30.4%, a difference of 0.020%), Immigrants from Cuba (30.3%, a difference of 0.22%), Mexican American Indian (30.2%, a difference of 0.49%), Chippewa (30.6%, a difference of 0.54%), and Bangladeshi (30.2%, a difference of 0.66%).
| Demographics | Rating | Rank | Bachelor's Degree |
| Cape Verdeans | 0.1 /100 | #293 | Tragic 30.9% |
| Immigrants | Guatemala | 0.0 /100 | #294 | Tragic 30.8% |
| Immigrants | Dominican Republic | 0.0 /100 | #295 | Tragic 30.7% |
| Puget Sound Salish | 0.0 /100 | #296 | Tragic 30.7% |
| Immigrants | Haiti | 0.0 /100 | #297 | Tragic 30.6% |
| Chippewa | 0.0 /100 | #298 | Tragic 30.6% |
| Chickasaw | 0.0 /100 | #299 | Tragic 30.4% |
| Immigrants | Micronesia | 0.0 /100 | #300 | Tragic 30.4% |
| Immigrants | Cuba | 0.0 /100 | #301 | Tragic 30.3% |
| Mexican American Indians | 0.0 /100 | #302 | Tragic 30.2% |
| Bangladeshis | 0.0 /100 | #303 | Tragic 30.2% |
| Cherokee | 0.0 /100 | #304 | Tragic 30.2% |
| Immigrants | Latin America | 0.0 /100 | #305 | Tragic 30.1% |
| Immigrants | Yemen | 0.0 /100 | #306 | Tragic 29.9% |
| Nepalese | 0.0 /100 | #307 | Tragic 29.9% |