Mexican vs Immigrants from Micronesia 5th Grade
COMPARE
Mexican
Immigrants from Micronesia
5th Grade
5th Grade Comparison
Mexicans
Immigrants from Micronesia
95.2%
5TH GRADE
0.0/ 100
METRIC RATING
335th/ 347
METRIC RANK
97.3%
5TH GRADE
48.8/ 100
METRIC RATING
175th/ 347
METRIC RANK
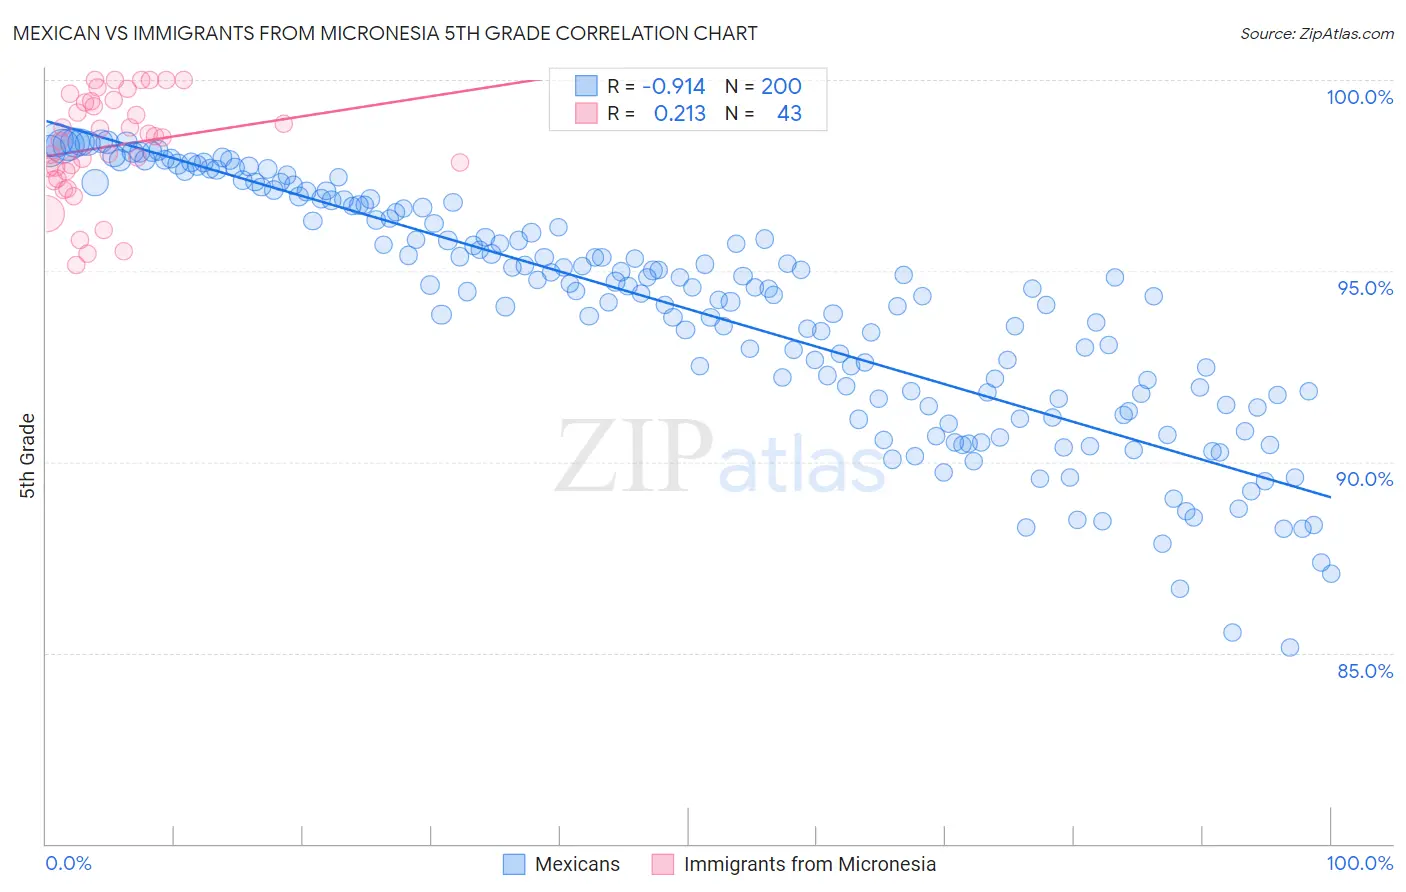
Mexican vs Immigrants from Micronesia 5th Grade Correlation Chart
The statistical analysis conducted on geographies consisting of 565,340,290 people shows a near-perfect negative correlation between the proportion of Mexicans and percentage of population with at least 5th grade education in the United States with a correlation coefficient (R) of -0.914 and weighted average of 95.2%. Similarly, the statistical analysis conducted on geographies consisting of 61,604,657 people shows a weak positive correlation between the proportion of Immigrants from Micronesia and percentage of population with at least 5th grade education in the United States with a correlation coefficient (R) of 0.213 and weighted average of 97.3%, a difference of 2.2%.
5th Grade Correlation Summary
| Measurement | Mexican | Immigrants from Micronesia |
| Minimum | 85.1% | 95.2% |
| Maximum | 98.4% | 100.0% |
| Range | 13.3% | 4.8% |
| Mean | 94.0% | 98.3% |
| Median | 94.6% | 98.5% |
| Interquartile 25% (IQ1) | 91.7% | 97.4% |
| Interquartile 75% (IQ3) | 96.7% | 99.4% |
| Interquartile Range (IQR) | 5.1% | 2.0% |
| Standard Deviation (Sample) | 3.1% | 1.4% |
| Standard Deviation (Population) | 3.1% | 1.4% |
Similar Demographics by 5th Grade
Demographics Similar to Mexicans by 5th Grade
In terms of 5th grade, the demographic groups most similar to Mexicans are Nepalese (95.2%, a difference of 0.030%), Immigrants from Latin America (95.3%, a difference of 0.050%), Immigrants from Dominican Republic (95.3%, a difference of 0.060%), Immigrants from the Azores (95.1%, a difference of 0.10%), and Immigrants from Honduras (95.4%, a difference of 0.16%).
| Demographics | Rating | Rank | 5th Grade |
| Cape Verdeans | 0.0 /100 | #328 | Tragic 95.5% |
| Mexican American Indians | 0.0 /100 | #329 | Tragic 95.5% |
| Immigrants | Armenia | 0.0 /100 | #330 | Tragic 95.4% |
| Immigrants | Honduras | 0.0 /100 | #331 | Tragic 95.4% |
| Immigrants | Dominican Republic | 0.0 /100 | #332 | Tragic 95.3% |
| Immigrants | Latin America | 0.0 /100 | #333 | Tragic 95.3% |
| Nepalese | 0.0 /100 | #334 | Tragic 95.2% |
| Mexicans | 0.0 /100 | #335 | Tragic 95.2% |
| Immigrants | Azores | 0.0 /100 | #336 | Tragic 95.1% |
| Central Americans | 0.0 /100 | #337 | Tragic 95.1% |
| Immigrants | Cabo Verde | 0.0 /100 | #338 | Tragic 94.9% |
| Immigrants | Yemen | 0.0 /100 | #339 | Tragic 94.9% |
| Guatemalans | 0.0 /100 | #340 | Tragic 94.8% |
| Yakama | 0.0 /100 | #341 | Tragic 94.8% |
| Immigrants | Central America | 0.0 /100 | #342 | Tragic 94.7% |
Demographics Similar to Immigrants from Micronesia by 5th Grade
In terms of 5th grade, the demographic groups most similar to Immigrants from Micronesia are Immigrants from Taiwan (97.3%, a difference of 0.0%), Egyptian (97.3%, a difference of 0.010%), Immigrants from Kazakhstan (97.3%, a difference of 0.010%), Immigrants from Spain (97.3%, a difference of 0.010%), and Chilean (97.3%, a difference of 0.020%).
| Demographics | Rating | Rank | 5th Grade |
| Chileans | 54.5 /100 | #168 | Average 97.3% |
| Immigrants | Korea | 54.1 /100 | #169 | Average 97.3% |
| Venezuelans | 54.0 /100 | #170 | Average 97.3% |
| Immigrants | Sri Lanka | 53.8 /100 | #171 | Average 97.3% |
| Arabs | 53.4 /100 | #172 | Average 97.3% |
| Egyptians | 52.4 /100 | #173 | Average 97.3% |
| Immigrants | Kazakhstan | 50.0 /100 | #174 | Average 97.3% |
| Immigrants | Micronesia | 48.8 /100 | #175 | Average 97.3% |
| Immigrants | Taiwan | 48.4 /100 | #176 | Average 97.3% |
| Immigrants | Spain | 47.0 /100 | #177 | Average 97.3% |
| Comanche | 42.1 /100 | #178 | Average 97.3% |
| Immigrants | Kenya | 40.3 /100 | #179 | Average 97.3% |
| Pakistanis | 40.2 /100 | #180 | Average 97.3% |
| Argentineans | 39.5 /100 | #181 | Fair 97.3% |
| Mongolians | 39.4 /100 | #182 | Fair 97.3% |