Mexican vs Immigrants from Micronesia Single Father Households
COMPARE
Mexican
Immigrants from Micronesia
Single Father Households
Single Father Households Comparison
Mexicans
Immigrants from Micronesia
3.0%
SINGLE FATHER HOUSEHOLDS
0.0/ 100
METRIC RATING
321st/ 347
METRIC RANK
2.6%
SINGLE FATHER HOUSEHOLDS
0.5/ 100
METRIC RATING
265th/ 347
METRIC RANK
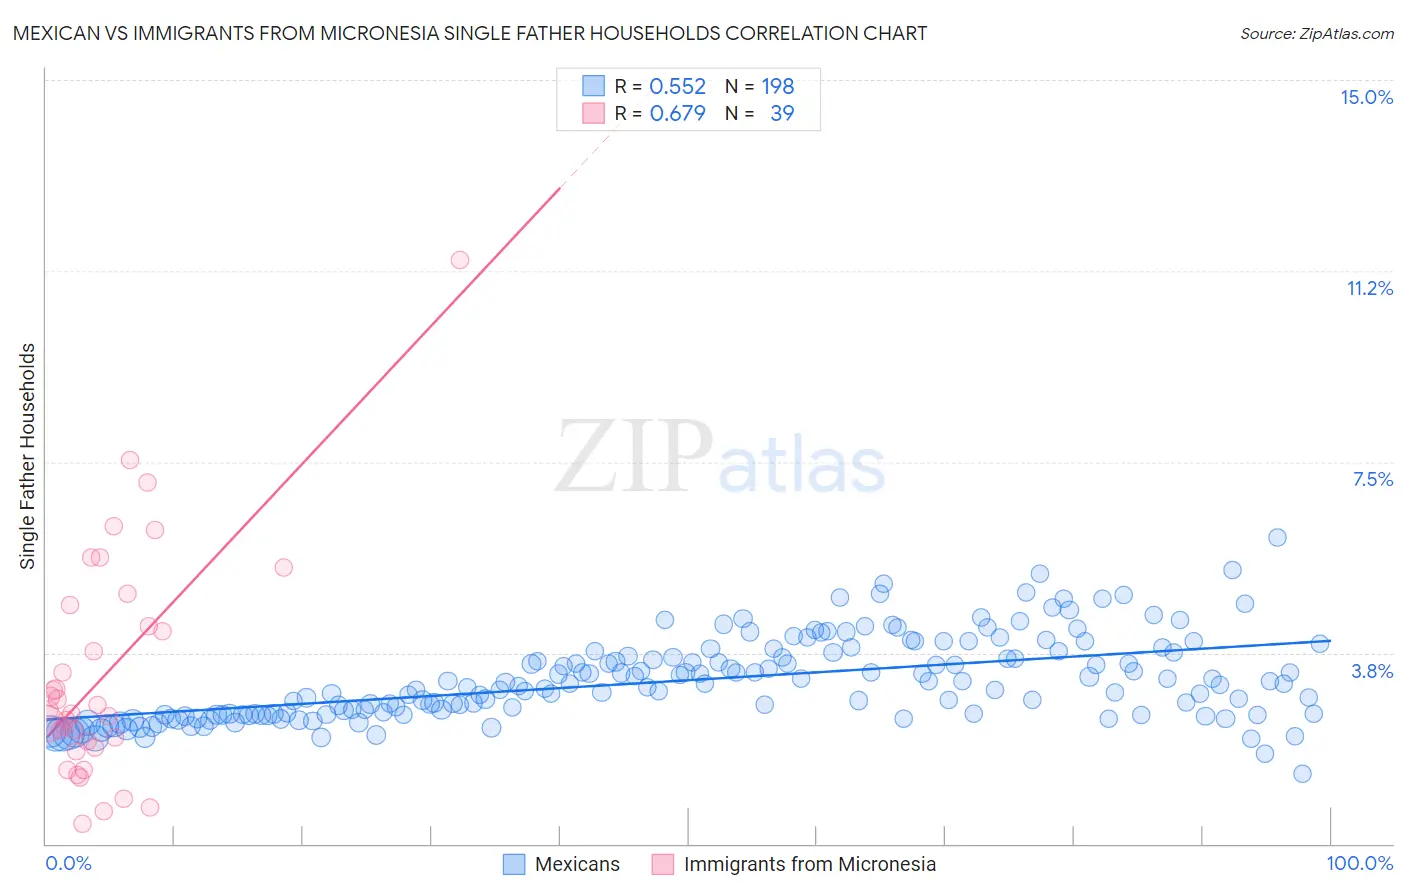
Mexican vs Immigrants from Micronesia Single Father Households Correlation Chart
The statistical analysis conducted on geographies consisting of 552,061,911 people shows a substantial positive correlation between the proportion of Mexicans and percentage of single father households in the United States with a correlation coefficient (R) of 0.552 and weighted average of 3.0%. Similarly, the statistical analysis conducted on geographies consisting of 61,525,430 people shows a significant positive correlation between the proportion of Immigrants from Micronesia and percentage of single father households in the United States with a correlation coefficient (R) of 0.679 and weighted average of 2.6%, a difference of 16.0%.
Single Father Households Correlation Summary
| Measurement | Mexican | Immigrants from Micronesia |
| Minimum | 1.4% | 0.38% |
| Maximum | 6.0% | 11.5% |
| Range | 4.6% | 11.1% |
| Mean | 3.2% | 3.3% |
| Median | 3.1% | 2.6% |
| Interquartile 25% (IQ1) | 2.5% | 1.9% |
| Interquartile 75% (IQ3) | 3.7% | 4.7% |
| Interquartile Range (IQR) | 1.1% | 2.8% |
| Standard Deviation (Sample) | 0.81% | 2.3% |
| Standard Deviation (Population) | 0.80% | 2.2% |
Similar Demographics by Single Father Households
Demographics Similar to Mexicans by Single Father Households
In terms of single father households, the demographic groups most similar to Mexicans are Guatemalan (3.0%, a difference of 0.39%), Ute (3.0%, a difference of 0.47%), Immigrants from Guatemala (3.0%, a difference of 0.53%), Immigrants from Central America (3.0%, a difference of 0.84%), and Fijian (3.0%, a difference of 0.92%).
| Demographics | Rating | Rank | Single Father Households |
| Salvadorans | 0.0 /100 | #314 | Tragic 2.9% |
| Cheyenne | 0.0 /100 | #315 | Tragic 2.9% |
| Houma | 0.0 /100 | #316 | Tragic 2.9% |
| Immigrants | El Salvador | 0.0 /100 | #317 | Tragic 2.9% |
| Cape Verdeans | 0.0 /100 | #318 | Tragic 2.9% |
| Ute | 0.0 /100 | #319 | Tragic 3.0% |
| Guatemalans | 0.0 /100 | #320 | Tragic 3.0% |
| Mexicans | 0.0 /100 | #321 | Tragic 3.0% |
| Immigrants | Guatemala | 0.0 /100 | #322 | Tragic 3.0% |
| Immigrants | Central America | 0.0 /100 | #323 | Tragic 3.0% |
| Fijians | 0.0 /100 | #324 | Tragic 3.0% |
| Immigrants | Mexico | 0.0 /100 | #325 | Tragic 3.0% |
| Aleuts | 0.0 /100 | #326 | Tragic 3.0% |
| Bangladeshis | 0.0 /100 | #327 | Tragic 3.1% |
| Immigrants | Cabo Verde | 0.0 /100 | #328 | Tragic 3.1% |
Demographics Similar to Immigrants from Micronesia by Single Father Households
In terms of single father households, the demographic groups most similar to Immigrants from Micronesia are French American Indian (2.6%, a difference of 0.040%), Indonesian (2.6%, a difference of 0.060%), Guamanian/Chamorro (2.6%, a difference of 0.52%), Haitian (2.6%, a difference of 0.56%), and Dominican (2.5%, a difference of 0.75%).
| Demographics | Rating | Rank | Single Father Households |
| Spanish | 1.1 /100 | #258 | Tragic 2.5% |
| Comanche | 1.0 /100 | #259 | Tragic 2.5% |
| Immigrants | Caribbean | 1.0 /100 | #260 | Tragic 2.5% |
| Immigrants | Belize | 0.9 /100 | #261 | Tragic 2.5% |
| Immigrants | Liberia | 0.8 /100 | #262 | Tragic 2.5% |
| Dominicans | 0.8 /100 | #263 | Tragic 2.5% |
| Indonesians | 0.5 /100 | #264 | Tragic 2.6% |
| Immigrants | Micronesia | 0.5 /100 | #265 | Tragic 2.6% |
| French American Indians | 0.5 /100 | #266 | Tragic 2.6% |
| Guamanians/Chamorros | 0.4 /100 | #267 | Tragic 2.6% |
| Haitians | 0.4 /100 | #268 | Tragic 2.6% |
| Cubans | 0.3 /100 | #269 | Tragic 2.6% |
| Seminole | 0.3 /100 | #270 | Tragic 2.6% |
| Creek | 0.2 /100 | #271 | Tragic 2.6% |
| Belizeans | 0.2 /100 | #272 | Tragic 2.6% |