Mexican vs Immigrants from Iran Bachelor's Degree
COMPARE
Mexican
Immigrants from Iran
Bachelor's Degree
Bachelor's Degree Comparison
Mexicans
Immigrants from Iran
27.1%
BACHELOR'S DEGREE
0.0/ 100
METRIC RATING
333rd/ 347
METRIC RANK
50.3%
BACHELOR'S DEGREE
100.0/ 100
METRIC RATING
7th/ 347
METRIC RANK
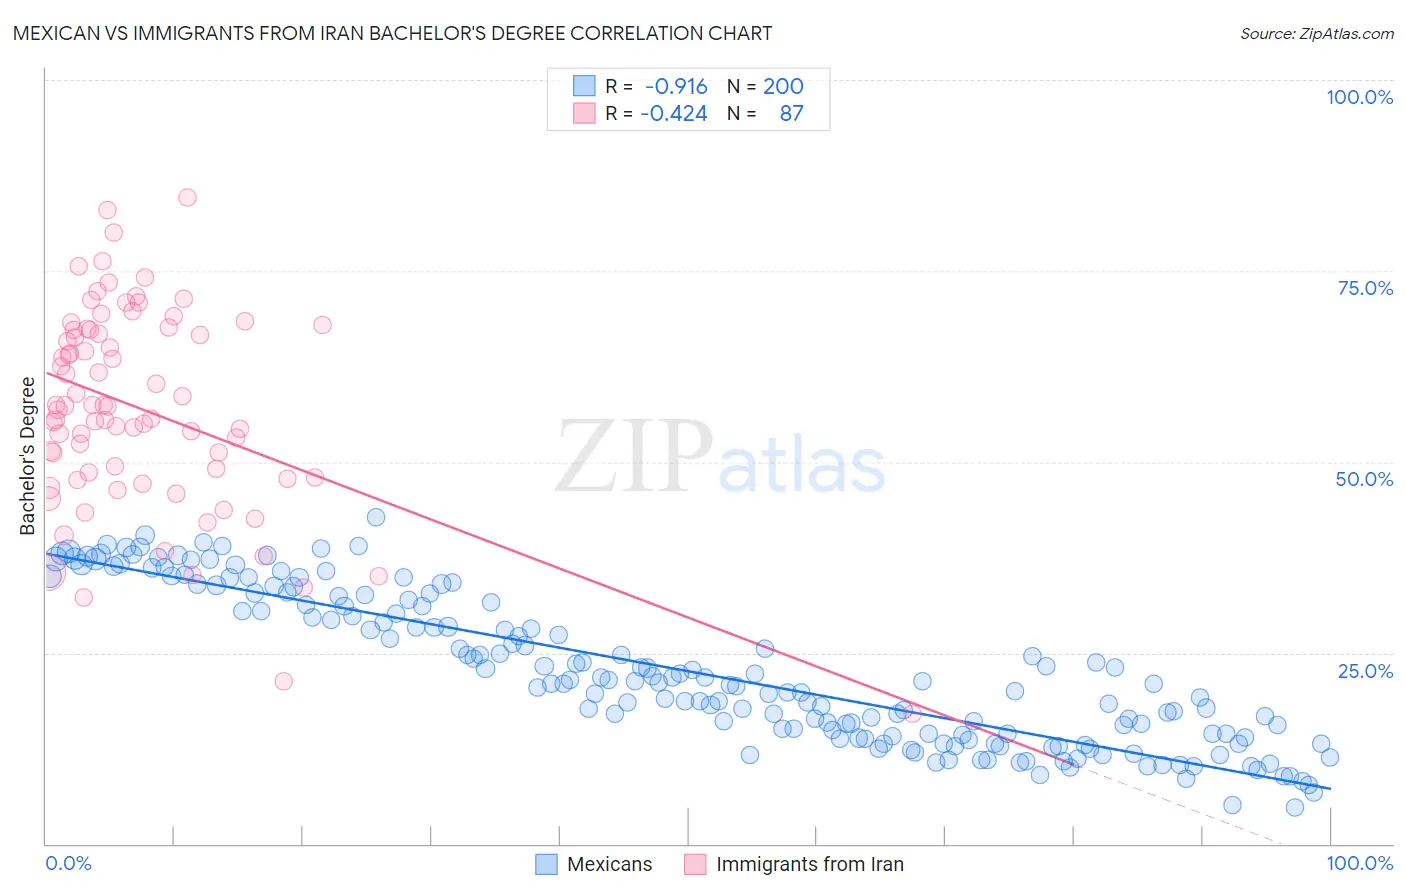
Mexican vs Immigrants from Iran Bachelor's Degree Correlation Chart
The statistical analysis conducted on geographies consisting of 565,096,566 people shows a near-perfect negative correlation between the proportion of Mexicans and percentage of population with at least bachelor's degree education in the United States with a correlation coefficient (R) of -0.916 and weighted average of 27.1%. Similarly, the statistical analysis conducted on geographies consisting of 279,901,674 people shows a moderate negative correlation between the proportion of Immigrants from Iran and percentage of population with at least bachelor's degree education in the United States with a correlation coefficient (R) of -0.424 and weighted average of 50.3%, a difference of 85.8%.
Bachelor's Degree Correlation Summary
| Measurement | Mexican | Immigrants from Iran |
| Minimum | 4.7% | 17.0% |
| Maximum | 42.7% | 84.6% |
| Range | 38.0% | 67.5% |
| Mean | 22.6% | 56.9% |
| Median | 21.0% | 57.3% |
| Interquartile 25% (IQ1) | 14.2% | 47.9% |
| Interquartile 75% (IQ3) | 31.5% | 67.3% |
| Interquartile Range (IQR) | 17.2% | 19.3% |
| Standard Deviation (Sample) | 9.7% | 13.2% |
| Standard Deviation (Population) | 9.7% | 13.1% |
Similar Demographics by Bachelor's Degree
Demographics Similar to Mexicans by Bachelor's Degree
In terms of bachelor's degree, the demographic groups most similar to Mexicans are Menominee (27.3%, a difference of 0.82%), Immigrants from the Azores (27.3%, a difference of 0.92%), Spanish American Indian (27.5%, a difference of 1.4%), Immigrants from Central America (27.5%, a difference of 1.5%), and Arapaho (26.6%, a difference of 1.7%).
| Demographics | Rating | Rank | Bachelor's Degree |
| Apache | 0.0 /100 | #326 | Tragic 28.3% |
| Paiute | 0.0 /100 | #327 | Tragic 28.1% |
| Crow | 0.0 /100 | #328 | Tragic 27.7% |
| Immigrants | Central America | 0.0 /100 | #329 | Tragic 27.5% |
| Spanish American Indians | 0.0 /100 | #330 | Tragic 27.5% |
| Immigrants | Azores | 0.0 /100 | #331 | Tragic 27.3% |
| Menominee | 0.0 /100 | #332 | Tragic 27.3% |
| Mexicans | 0.0 /100 | #333 | Tragic 27.1% |
| Arapaho | 0.0 /100 | #334 | Tragic 26.6% |
| Natives/Alaskans | 0.0 /100 | #335 | Tragic 26.3% |
| Immigrants | Mexico | 0.0 /100 | #336 | Tragic 26.1% |
| Inupiat | 0.0 /100 | #337 | Tragic 25.8% |
| Pueblo | 0.0 /100 | #338 | Tragic 25.5% |
| Hopi | 0.0 /100 | #339 | Tragic 25.3% |
| Lumbee | 0.0 /100 | #340 | Tragic 24.8% |
Demographics Similar to Immigrants from Iran by Bachelor's Degree
In terms of bachelor's degree, the demographic groups most similar to Immigrants from Iran are Thai (50.1%, a difference of 0.37%), Okinawan (50.5%, a difference of 0.48%), Immigrants from Israel (50.0%, a difference of 0.61%), Iranian (51.0%, a difference of 1.3%), and Immigrants from Taiwan (51.2%, a difference of 1.7%).
| Demographics | Rating | Rank | Bachelor's Degree |
| Filipinos | 100.0 /100 | #1 | Exceptional 52.7% |
| Immigrants | Singapore | 100.0 /100 | #2 | Exceptional 51.9% |
| Immigrants | India | 100.0 /100 | #3 | Exceptional 51.3% |
| Immigrants | Taiwan | 100.0 /100 | #4 | Exceptional 51.2% |
| Iranians | 100.0 /100 | #5 | Exceptional 51.0% |
| Okinawans | 100.0 /100 | #6 | Exceptional 50.5% |
| Immigrants | Iran | 100.0 /100 | #7 | Exceptional 50.3% |
| Thais | 100.0 /100 | #8 | Exceptional 50.1% |
| Immigrants | Israel | 100.0 /100 | #9 | Exceptional 50.0% |
| Cypriots | 100.0 /100 | #10 | Exceptional 49.0% |
| Immigrants | Australia | 100.0 /100 | #11 | Exceptional 48.5% |
| Immigrants | China | 100.0 /100 | #12 | Exceptional 48.4% |
| Immigrants | South Central Asia | 100.0 /100 | #13 | Exceptional 48.3% |
| Immigrants | Hong Kong | 100.0 /100 | #14 | Exceptional 48.2% |
| Immigrants | Eastern Asia | 100.0 /100 | #15 | Exceptional 48.1% |