Mexican vs Immigrants from Micronesia Householder Income Over 65 years
COMPARE
Mexican
Immigrants from Micronesia
Householder Income Over 65 years
Householder Income Over 65 years Comparison
Mexicans
Immigrants from Micronesia
$53,897
HOUSEHOLDER INCOME OVER 65 YEARS
0.1/ 100
METRIC RATING
285th/ 347
METRIC RANK
$61,000
HOUSEHOLDER INCOME OVER 65 YEARS
50.8/ 100
METRIC RATING
173rd/ 347
METRIC RANK
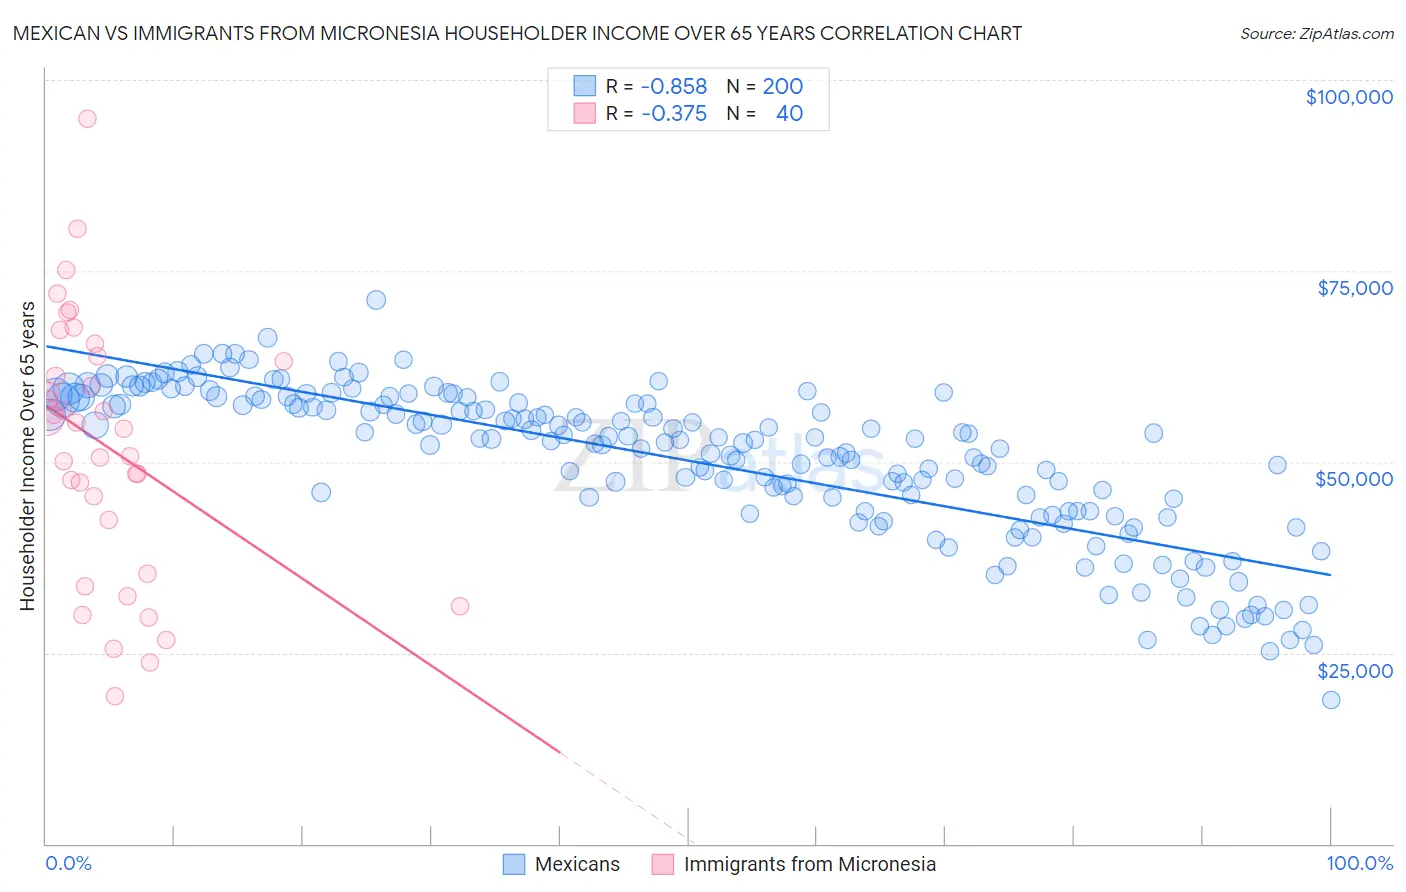
Mexican vs Immigrants from Micronesia Householder Income Over 65 years Correlation Chart
The statistical analysis conducted on geographies consisting of 559,960,320 people shows a very strong negative correlation between the proportion of Mexicans and household income with householder over the age of 65 in the United States with a correlation coefficient (R) of -0.858 and weighted average of $53,897. Similarly, the statistical analysis conducted on geographies consisting of 61,368,968 people shows a mild negative correlation between the proportion of Immigrants from Micronesia and household income with householder over the age of 65 in the United States with a correlation coefficient (R) of -0.375 and weighted average of $61,000, a difference of 13.2%.
Householder Income Over 65 years Correlation Summary
| Measurement | Mexican | Immigrants from Micronesia |
| Minimum | $18,818 | $19,375 |
| Maximum | $71,178 | $94,868 |
| Range | $52,360 | $75,493 |
| Mean | $50,150 | $52,032 |
| Median | $52,997 | $54,757 |
| Interquartile 25% (IQ1) | $43,543 | $38,889 |
| Interquartile 75% (IQ3) | $58,155 | $63,458 |
| Interquartile Range (IQR) | $14,612 | $24,569 |
| Standard Deviation (Sample) | $10,117 | $17,019 |
| Standard Deviation (Population) | $10,091 | $16,805 |
Similar Demographics by Householder Income Over 65 years
Demographics Similar to Mexicans by Householder Income Over 65 years
In terms of householder income over 65 years, the demographic groups most similar to Mexicans are Chippewa ($53,847, a difference of 0.090%), Immigrants from Guatemala ($53,950, a difference of 0.10%), Immigrants from Liberia ($53,967, a difference of 0.13%), Immigrants from Armenia ($53,974, a difference of 0.14%), and Somali ($54,004, a difference of 0.20%).
| Demographics | Rating | Rank | Householder Income Over 65 years |
| Immigrants | Ecuador | 0.1 /100 | #278 | Tragic $54,030 |
| Blackfeet | 0.1 /100 | #279 | Tragic $54,029 |
| Immigrants | Jamaica | 0.1 /100 | #280 | Tragic $54,027 |
| Somalis | 0.1 /100 | #281 | Tragic $54,004 |
| Immigrants | Armenia | 0.1 /100 | #282 | Tragic $53,974 |
| Immigrants | Liberia | 0.1 /100 | #283 | Tragic $53,967 |
| Immigrants | Guatemala | 0.1 /100 | #284 | Tragic $53,950 |
| Mexicans | 0.1 /100 | #285 | Tragic $53,897 |
| Chippewa | 0.1 /100 | #286 | Tragic $53,847 |
| Immigrants | Barbados | 0.1 /100 | #287 | Tragic $53,766 |
| Paiute | 0.1 /100 | #288 | Tragic $53,762 |
| Iroquois | 0.1 /100 | #289 | Tragic $53,737 |
| Chickasaw | 0.1 /100 | #290 | Tragic $53,732 |
| Africans | 0.0 /100 | #291 | Tragic $53,711 |
| Shoshone | 0.0 /100 | #292 | Tragic $53,681 |
Demographics Similar to Immigrants from Micronesia by Householder Income Over 65 years
In terms of householder income over 65 years, the demographic groups most similar to Immigrants from Micronesia are Luxembourger ($60,967, a difference of 0.050%), Immigrants from Poland ($61,041, a difference of 0.070%), Inupiat ($61,061, a difference of 0.10%), Serbian ($61,087, a difference of 0.14%), and Carpatho Rusyn ($61,093, a difference of 0.15%).
| Demographics | Rating | Rank | Householder Income Over 65 years |
| Immigrants | Eastern Africa | 55.0 /100 | #166 | Average $61,157 |
| Norwegians | 53.6 /100 | #167 | Average $61,104 |
| Irish | 53.4 /100 | #168 | Average $61,097 |
| Carpatho Rusyns | 53.3 /100 | #169 | Average $61,093 |
| Serbians | 53.1 /100 | #170 | Average $61,087 |
| Inupiat | 52.4 /100 | #171 | Average $61,061 |
| Immigrants | Poland | 51.9 /100 | #172 | Average $61,041 |
| Immigrants | Micronesia | 50.8 /100 | #173 | Average $61,000 |
| Luxembourgers | 50.0 /100 | #174 | Average $60,967 |
| Spaniards | 47.3 /100 | #175 | Average $60,866 |
| Spanish | 45.5 /100 | #176 | Average $60,795 |
| Alaska Natives | 44.3 /100 | #177 | Average $60,748 |
| Yup'ik | 43.7 /100 | #178 | Average $60,727 |
| Welsh | 42.2 /100 | #179 | Average $60,666 |
| Immigrants | Morocco | 41.7 /100 | #180 | Average $60,647 |